Business Reporting
For curious and passionate people: Icinga brings all the pieces together and provides a valuable overview over your business-critical applications.

Get insights into the most important parts of your infrastructure

Identify problems within a glimpse

Build custom dashboards for teams, technologies, locations and more

Combine monitoring data into Business Processes

Search efficiently for relevant monitoring data

Create custom SLA reports with personalized PDFs

Custom Dashboards
Getting quick access to relevant data is crucial for everyone maintaining an IT infrastructure. Icinga provides that information with only one click by allowing you to create custom dashboards.
A considerable number of different filter options enables you to search for and group different areas and segments of your infrastructure. Whether it’s by name, location, current state, past events, or many other filters. You get exactly the results that are important for your use case. Saving those queries in custom widgets and dashboards makes the results accessible at any time.

Business Process Monitoring
While it is necessary and wise to collect precise information about each and every running service in your infrastructure, sometimes it is crucial to get a global overview to draw conclusions. Icinga combines the results of multiple monitoring checks to visualize and alert about the overall state of your business-critical applications.
- Combine the state of multiple resources to one global Business Process
- Create sophisticated Business Processes with logical functions (and, or, min)
- Receive alerts based on the calculated state of a Business Process
- Build dashboards everyone understands in a glimpse
SLA Reporting
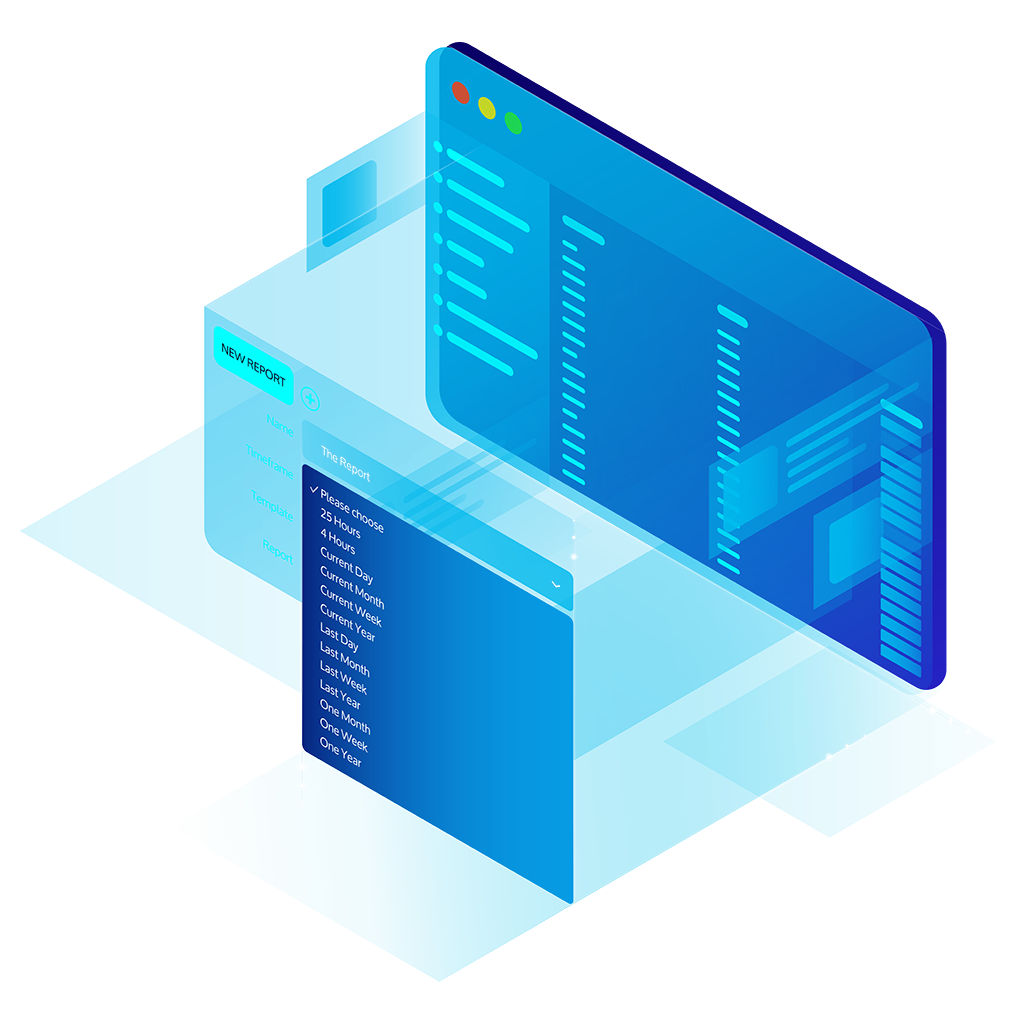
Icinga calculates and reports the SLAs of filterable groups of hosts or services based on the monitoring results collected over time. Icinga Reporting takes planned maintenance windows into account, allowing you to create reports for customizable time frames.
- Create SLA reports manually or periodically (every week, month, …)
- Build custom reports for certain customers, tenants or teams
- Include extensive filtering capabilities to catch only the results you need
- Receive PDFs of the SLA report via Email, automatically and repetitively
- Build custom layouts for SLA reporting PDFs
Data Export
The data visualized by Icinga Web can be exported to different format, such as CSV, JSON or PDF. This permits you to export certain data based on detailed filtering. Since the Icinga Web interface comes with its own API, exporting the data can be done programmatically by your custom scripts or tools.

Get Started with Icinga
Get going with your full-stack enterprise-ready server monitoring solution. Follow the installation course for a seamless setup with Icinga.


