Metrics & Logs
Get the Context and Recognize Trends
Collect data on the fly and evaluate the performance of your systems for fast troubleshooting and future-proof capacity planning.
See the Full Picture
Handling logs and metrics is essential to achieve true observability. They are a real game changer for debugging, performance analysis and capacity planning. Use that variety of information from your systems to get a proper context during your root cause investigation.

Monitoring metrics
The Finest Collection
A full collection is always a fine collection. Collect and store metrics in a time-series database to get a full picture of the past. Understand the present, plan the future. Monitor based on the measurement of time-series data.
Monitoring Logs
The Story of Your Systems
What happened so far? Don’t we all want to know this in light of an unexpected event? Logs are like the diary of your environment. Use them to know more. Search for patterns and get alerted when they appear or do not. Monitor based on events.


visualization and analysis
Have a Future-Proof Plan
Noone likes to make the same mistakes again and again. Recognize recurring problems by recognizing patterns. Combine check results, metrics and logs in one web interface and draw from that goldmine of information to make your life easier.
Collect, measure, combine and know with greater confidence.
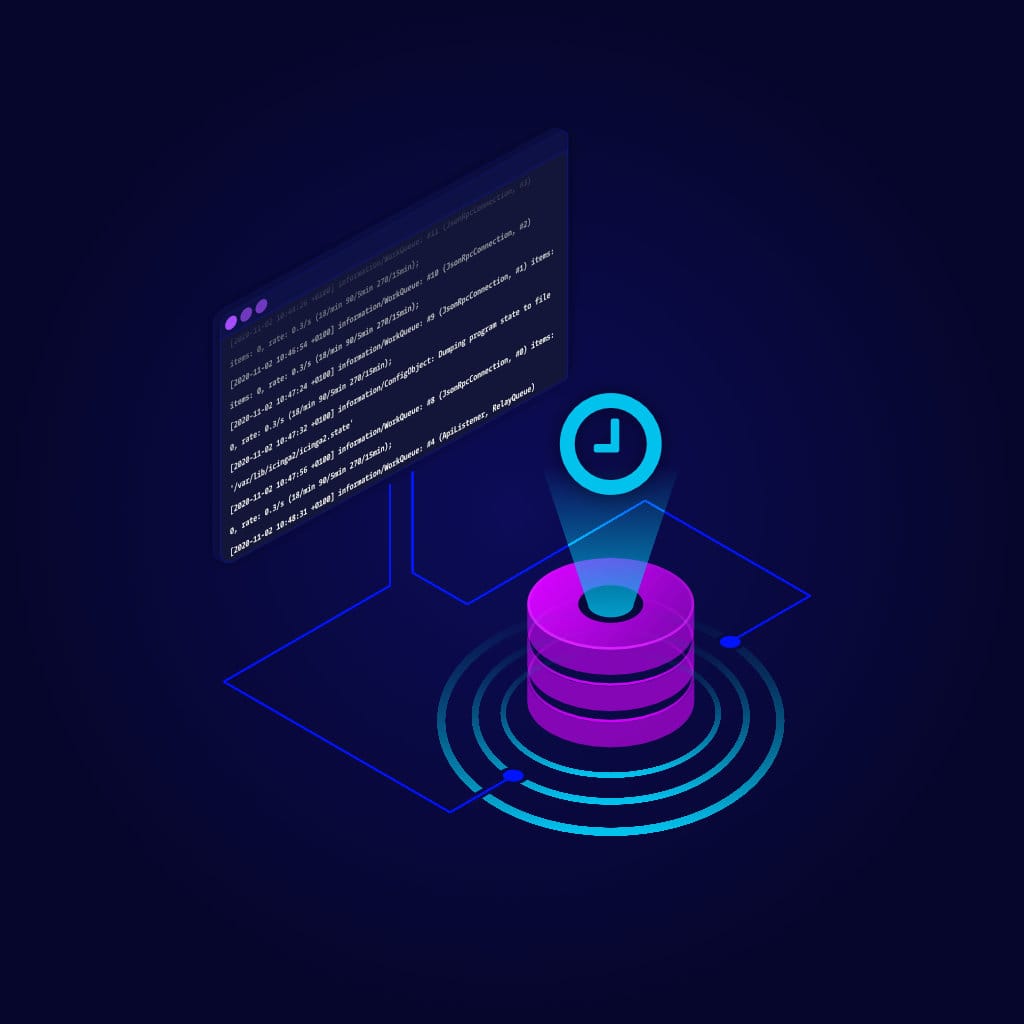
Collect and Store Information
Icinga checks not only the status of your infrastructure, but also collects metrics and searches for patterns directly in your log files and log management tools.
- Store metrics collected by Icinga in time-series databases. Work with integrated writers like Graphite, InfluxDB, Elasticsearch or OpenTSDB.
- Monitor log files or query log management tools such as Elasticsearch and Graylog.
- Use our Logstash plugin to automatically create objects in Icinga based on logs.
- Monitor the monitor, e.g. with Icingabeat, Elasticsearch and Kibana.
Bring all Data Together
Visualize your checks, logs and metrics all in one single interface to get a better context. Use Icinga modules to import and display them in Icinga Web. Clean visualizations help you to view historical data, speed up debugging and optimize your resources and capacity planning.
- Visualize your metrics stored in Graphite in the Icinga Web interface.
- Use the rich set of pre-configured templates or create your own ones.
- Display logs collected with the ELK stack or Graylog in Icinga Web.
- Or you use Grafana to visualize the metrics collected by Icinga.

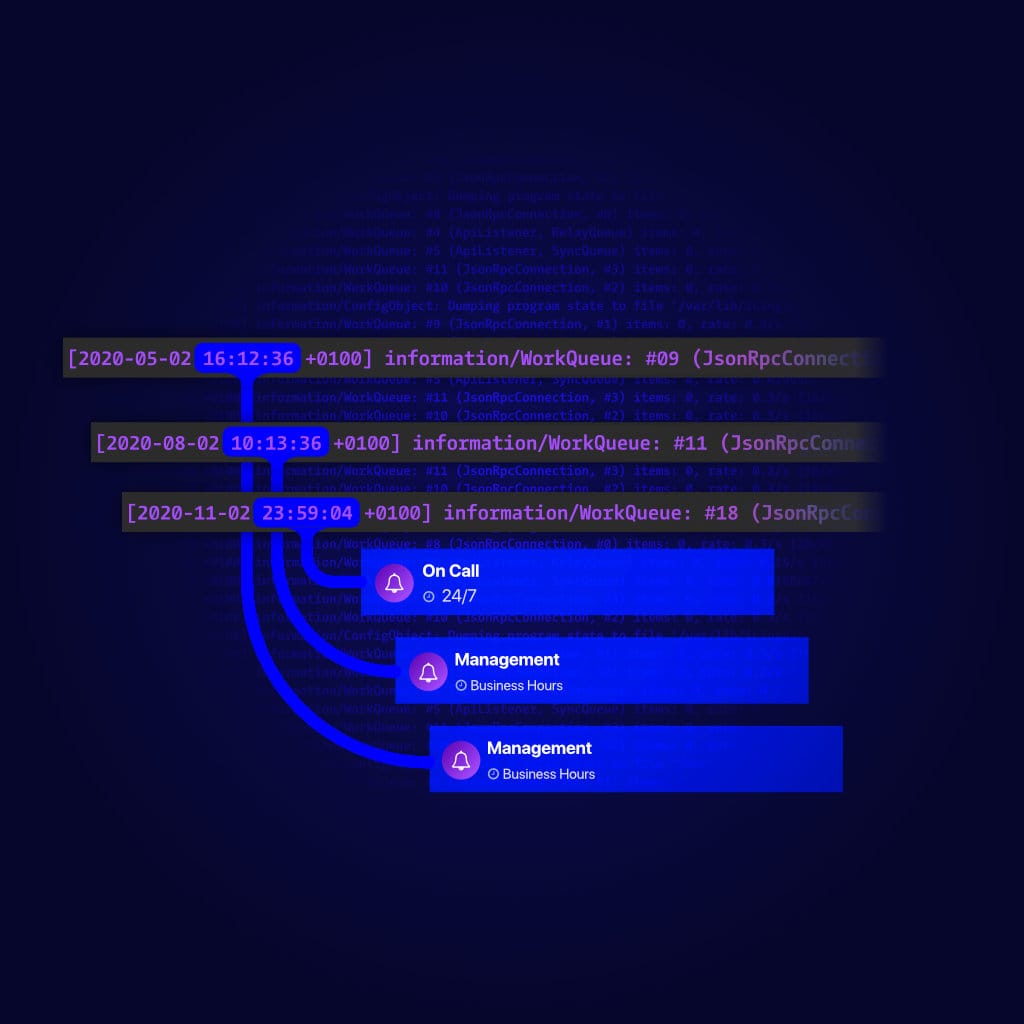
Base Alerts on Metrics and Logs
With your collected data stored and structured it’s easy to automate checks and notifications. Detect problems automatically and stay in the loop.
- Create special checks for metrics and logs that trigger alerts based on the results.
- Create notification rules on any metric or log stream.
- Take all the available data into account for alerting.
- Stay informed and confident at any time.
Do more with Icinga
Bring the speed, scale, and relevance of Icinga to all areas of your business.

Explore Icinga

Infrastructure Monitoring
Learn more

Monitoring Automation
Monitor massive amounts of data.
Learn more

Cloud Monitoring
Learn more

Metrics & Logs
Get the context and recognize trends.
Learn more

Analytics
Learn more

Notifications
Learn more
