Analytics
Analyze Your Data and Perform Proactively
Filter and group, customize searches and combine results. Icinga allows you to gain a fast overview and deep insights.

Bring Light into the Dark
Detailed and customizable searches allow you to evaluate and analyze your monitoring data. Identify bottlenecks in your infrastructure, partial downtimes in certain network segments and review the historical uptime of each of your servers and applications.

multiple use cases
From A to B
While your whole infrastructure is constantly observed you only need to look at data that is important to understand the overall health and certain aspects of it. Business processes, reports and custom dashboards help by merging scattered data for specific use cases. Trace connections, draw conclusions.
Search options
Filter, Find, Fix
Draw from a wide range of filters to funnel your monitoring data and narrow things down to the decisive puzzle piece of an incident. Work with placeholders in your search and with a uniform schema. Free search from limitations and generate the added value that makes you thrive.


Customization
The Perfect Logic
Depending on responsibilities everyone in your team has a different perspective on your monitoring data. Create the perfect filter logic and combination of widgets with different graphical views. Save your customized dashboard now to save time later.
Search with less effort. Get the results that result in success.
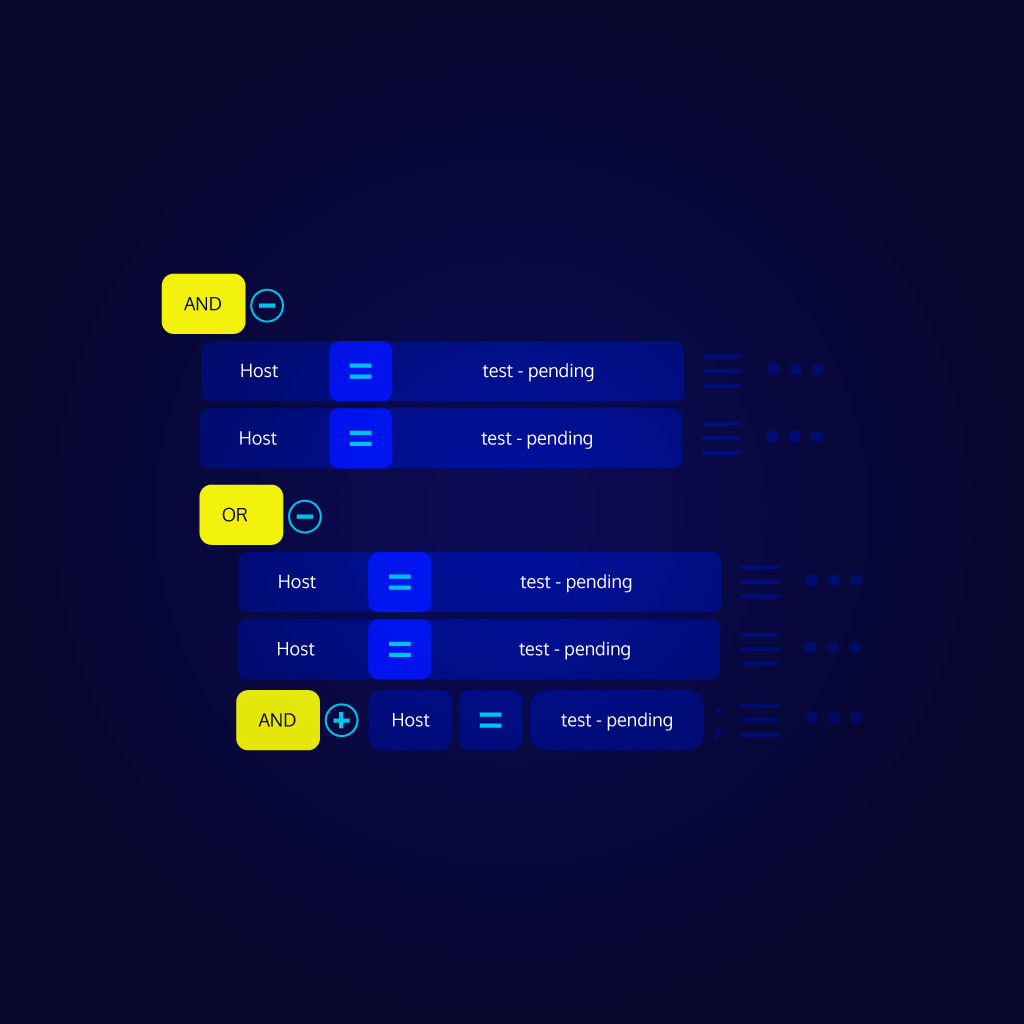
Dedicate Your Dashboards to Success
Icinga’s built-in dashboards allow you to create custom overviews based on filtered results. Creating specific dashboards for different use cases saves a lot of time when searching for monitoring results, especially in large environments.
- The filter editor enables you to search for very specific information.
- Combine several widgets, e.g. filtered lists, business processes, cubes.
- Save your fine-grained queries for fast access either through dashboard widgets or with separate menu entries.
- Create and save theme-based dashboards for separate teams and use cases.
Thrive with Business Process Modelling
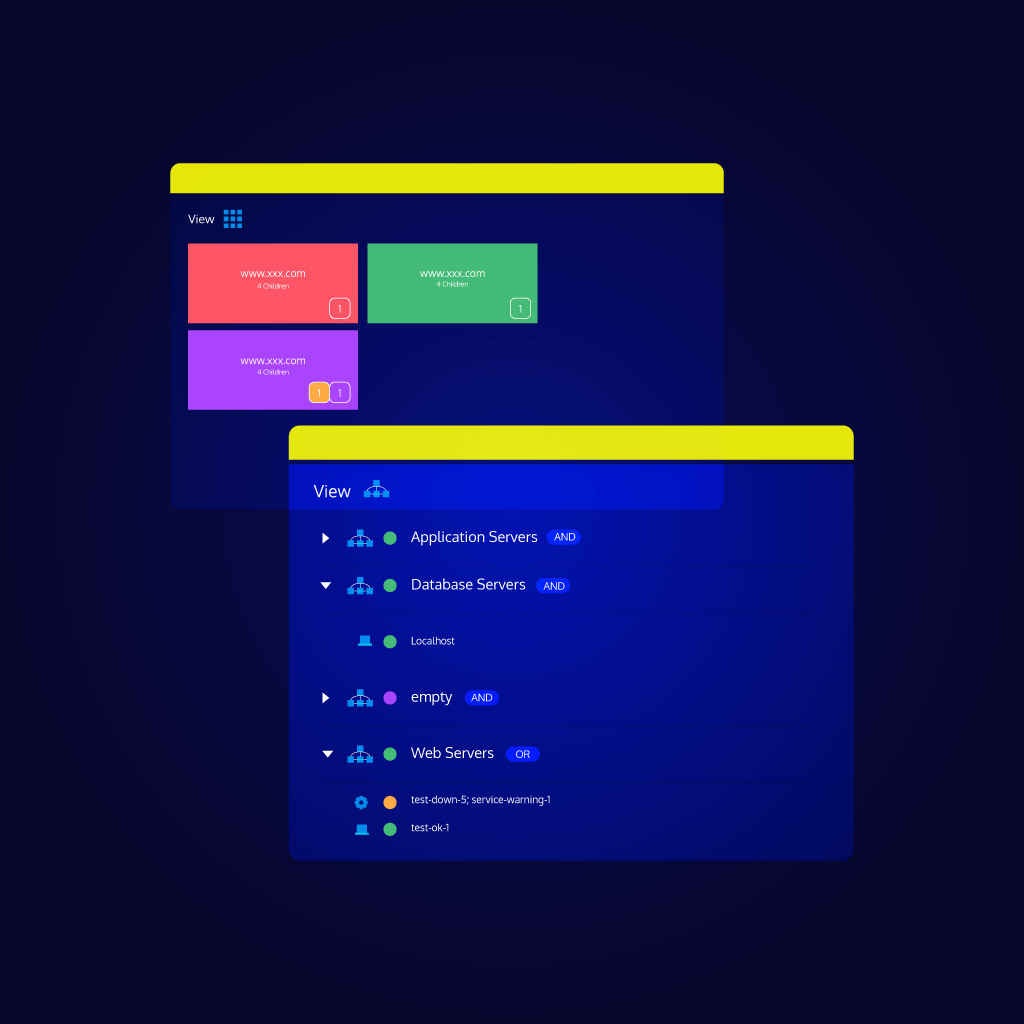
Monitoring the health of your application often requires to take multiple parts of the infrastructure into account. Icinga allows you to combine the results of multiple servers and services to get information about the overall health and availability of your application or other business processes.
- Combine several servers and applications into one logical unit.
- Quickly see if a major failure is occurring without having to know the details.
- Visualize only the summary, not every detail.
- Get notified based on a business process.
Let Your Reporting Rock
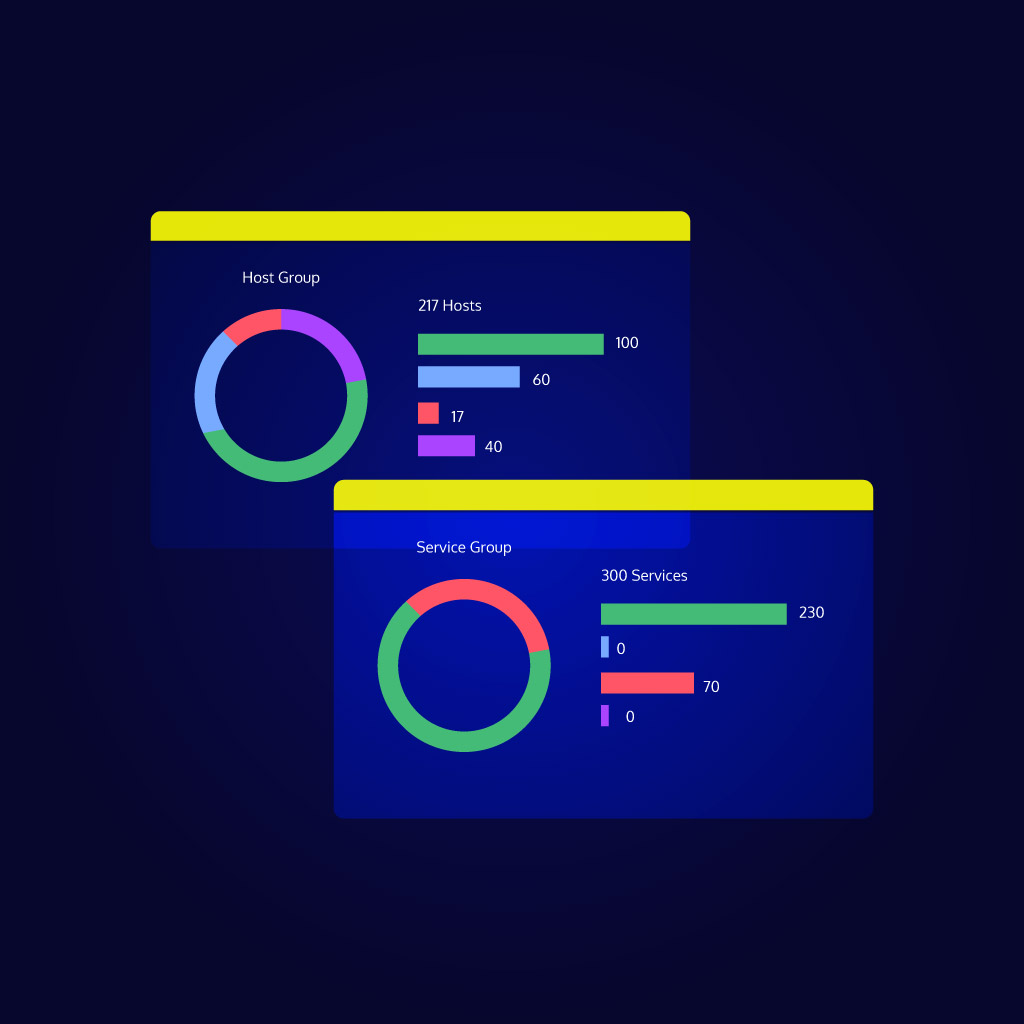
Icinga’s reporting allows you to calculate the availability of hosts and services based on the historical data. Make sure you match your SLA (Service Level Agreement) by regularly comparing the calculated percentage numbers.
- Stay informed about the long-term availability of your systems.
- Provide all information to teammates and contractors.
- Preview reports in Icinga or export them as PDF.
- Receive and share reports automatically at regular intervals.
- Prove that you have met the SLA.
Understand Root Causes with Dependency Views
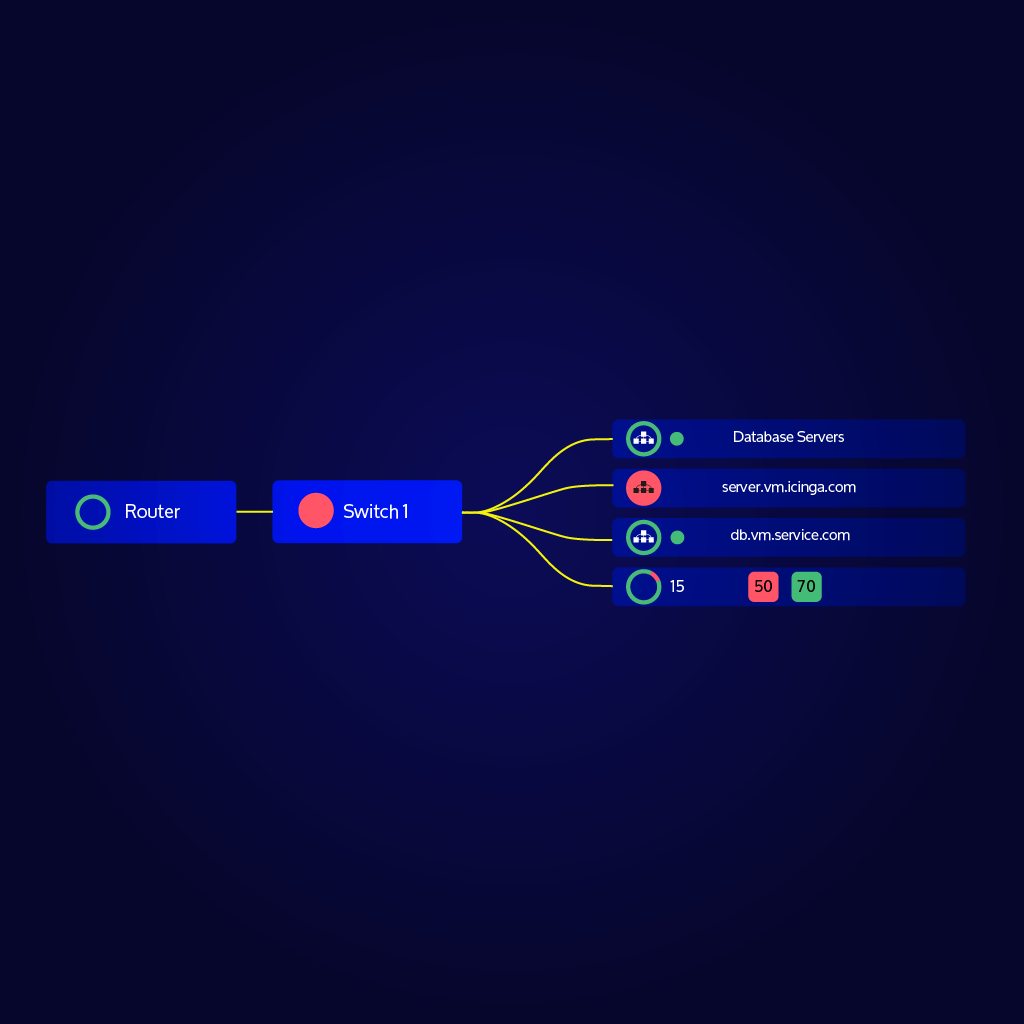
In complex infrastructures, not every issue requires your immediate attention. Icinga’s Dependency Views help you see the bigger picture by identifying the real root cause behind problems and suppressing unnecessary alerts.
- Visualize parent-child relationships between hosts and services.
- Automatically suppress notifications for dependent services and systems.
- Reduce alert noise and focus on what really matters.
- Quickly identify cascading failures and fix issues at the source.
Do more with Icinga
Bring the speed, scale, and relevance of Icinga to all areas of your business.

Explore Icinga

Infrastructure Monitoring
Learn more

Monitoring Automation
Monitor massive amounts of data.
Learn more

Cloud Monitoring
Learn more
Metrics & Logs
Get the context and recognize trends.
Learn more

Analytics
Learn more

Notifications
Learn more
