This is a guest blogpost by Markus Opolka from the Icinga Enterprise Partner NETWAYS.
After forking the Grafana Module for Icinga Web last year, we started thinking about alternative ways to display Icinga performance data graphically in the web interface. Running a separate Grafana instance just to render graphs is a lot of overhead and adds operational complexity — no matter how much you like Grafana. Plus, installing the grafana-image-renderer isn’t always straightforward.
So we took a closer look and tried building an Icinga Web module to address these challenges.
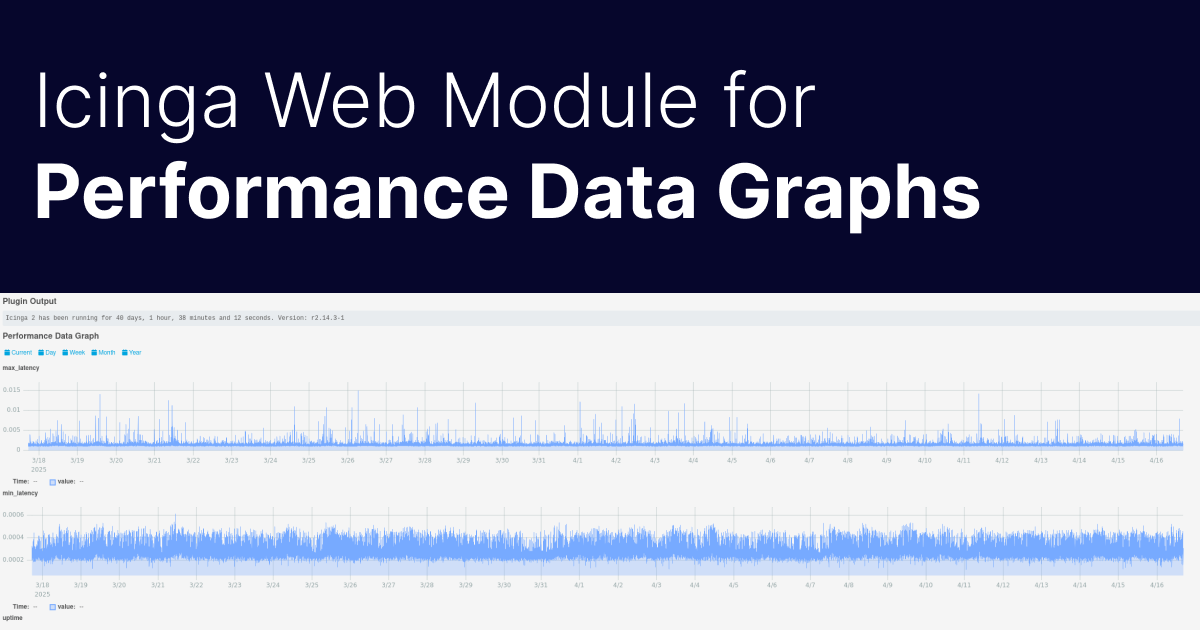
The result is the Icinga Web Module for Performance Data Graphs. This new module is easy to install and renders graphs for performance data directly in the browser. No additional software needed!
How does it work?
Behind the scenes, the new module actually consists of several smaller modules, each handling different aspects:
- A frontend module responsible for rendering the fancy graphs
- And backend modules that fetch and process the data
We decided to write multiple small backend modules instead of one big one that supports all possible data sources. So there’s one backend module per data source (Graphite, InfluxDB, Elasticsearch, etc.), and a central frontend module.
This approach lets each module focus on a single task without risking negative side effects for other sources. Thanks to the separation between rendering and data fetching, it’s also easy to add more data sources or tailor existing ones to your needs.
The entire code is open source under the GPL-2.0 license. At the moment, we have backend implementations for InfluxDBv1, InfluxDBv2, and Graphite. Elasticsearch and OpenSearch are still on the roadmap.
How to install and configure:
First, install and the central frontend module and one of the data source modules, depending on which writer you’re using in Icinga:
git clone https://github.com/NETWAYS/icingaweb2-module-perfdatagraphs.git /usr/share/icingaweb2/modules/perfdatagraphs
git clone https://github.com/NETWAYS/icingaweb2-module-perfdatagraphs-graphite.git /usr/share/icingaweb2/modules/perfdatagraphsgraphite
And enable them, like so:
icingacli module enable perfdatagraphs
icingacli module enable perfdatagraphsgraphite
Next, configure the data source either via the module UI in the browser or directly in the INI file:
/etc/icingaweb2/modules/perfdatagraphsgraphite/config.ini
[graphite]
api_url = "https://graphite.netways.de:8081"
api_username = "markus"
api_password = "******"
api_timeout = "5"
Once both modules are enabled, graphs will automatically be displayed for hosts and services. Currently, a separate graph is generated for each performance data time series. This is because the value ranges for a single plugin can vary greatly, for example, one metric might be in the double digits while another is in the range of a fraction.
You can adjust the graphs using Icinga custom variables – for instance, to include or exclude specific metrics or highlight one as the primary graph, the rest can be shown in one click:
apply Service "icinga" {
  vars.perfdatagraphs_config_metrics_include = ["uptime", "*_latency"]
  vars.perfdatagraphs_config_metrics_exclude = ["avg_latency"]

  vars.perfdatagraphs_config_highlight = "max_latency"
}
One feature we’re still working on is automatic unit conversion. You can already pass the unit of a metric as a variable, which will be shown in the graph and may trigger conversion functions (e.g., bytes, seconds, percentage):
apply Service "ping6" {
  vars.perfdatagraphs_metrics["pl"] = {
    unit = "percentage"
  }
  vars.perfdatagraphs_metrics["rta"] = {
    unit = "seconds"
  }
}
Of course, you can also disable graphs entirely:
apply Service "ping4" {
  vars.perfdatagraphs_config_disable = true
}
This module is still very new and there are many things we want to improve, but we’d like to make it available to everyone along the way. So feel free to try it out!
The goal isn’t to replace Grafana – Grafana is way too cool for that – but to offer a simple, easy-to-install solution for displaying performance data graphs in Icinga Web. And the data can still be used in Grafana if needed.
We’d love your feedback and pull requests on GitHub!
NETWAYS supports companies in setting up, monitoring, automating and managing IT infrastructures based on open source. As an open-source focussed Icinga Enterprise Partner they accompany their customers from the concept phase and consultation through the complete implementation of their project to training and support. If you’re interested in sponsorship or support with the new graphs, feel free to contact the NETWAYS outsourcing or sales team.
This is a guest blogpost by Markus Opolka from the Icinga Enterprise Partner NETWAYS.


