As some of you might have already noticed, we recently gave our official Icinga 2 container image builds a complete overhaul. These new images are currently available only as snapshot builds but...
Enhanced Icinga 2 Container Images
As some of you might have already noticed, we recently gave our official Icinga 2 container image builds a complete overhaul. These new images are currently available only as snapshot builds but...
How to check CPU usage on Linux
When your Linux system feels sluggish, one of the first things to investigate is the CPU usage. The CPU (Central Processing Unit) is the brain of your machine, and if it’s overloaded, everything else slows down. In this guide, you’ll learn different ways to Linux...
What is SNMP Trap: Real-Time Alerts for Network Monitoring
Why wait for the next poll? An SNMP trap is a real-time alert sent from a device to a monitoring system, without waiting for polling. Ever had a router die silently at 3 AM while your monitoring system was still polling away every 5 minutes? Yeah… not fun. That’s...

Using the Icinga Web API
Unfortunately, there is little to no documentation for using the Icinga Web API to perform monitoring actions such as scheduling downtimes. But it's a simple thing and I'll give you a quick example of how to do it. Using the Icinga Web API instead of the Icinga API...

Using Thola for monitoring your network devices
This is a guest blogpost by Alexander Biehl from the Thola development team. --- Once upon a time there was a small company in the south west of Germany that used an old check plugin for monitoring its network devices. But as their network got bigger and bigger over...

Docker: You’ve got mail!
So far we’ve chosen base images for our Icinga 2, Icinga Web 2 and Icinga DB Docker images, further reduced the image size and even taken care for security and comfort. Additionally Eric put all the images together via Docker Compose. But there’s still one little...
How to fetch data from Icinga Web
There are multiple ways to interact programatically with Icinga. Last week Henrik demonstrated how to connect to the Icinga 2 API through the Icinga 2 Console. Working with the Icinga 2 API is probably the most obvious way to interact with Icinga. Still, I would like...
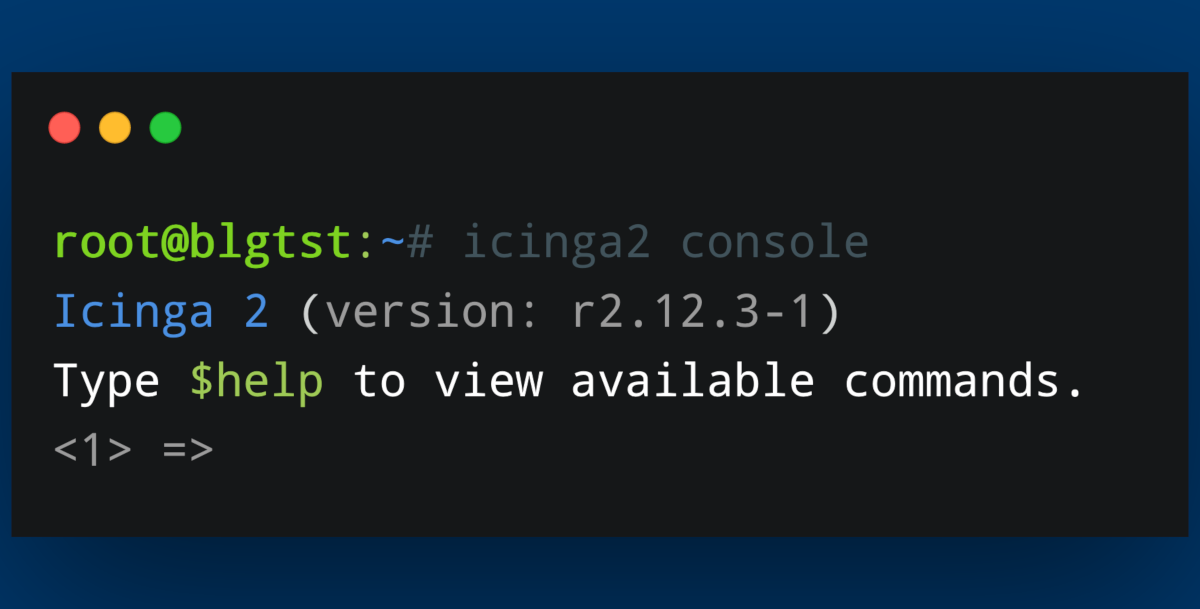
How to connect to the Icinga 2 API via the Icinga Console
Today I will show you a couple of small functions you can use with the Icinga Console. Using the Icinga Console can help with scripting in general and provides a quick and easy-to-use way of extracting information from your Icinga environment. We will take a look at...

Interview with Angelika Bang, new Partner Manager at Icinga
Could you just quickly describe where you come from? Actually, my professional background is in B2C brand and communication research. Over many years I have managed market research studies that helped brand manufacturers like Mercedes-Benz to understand their...
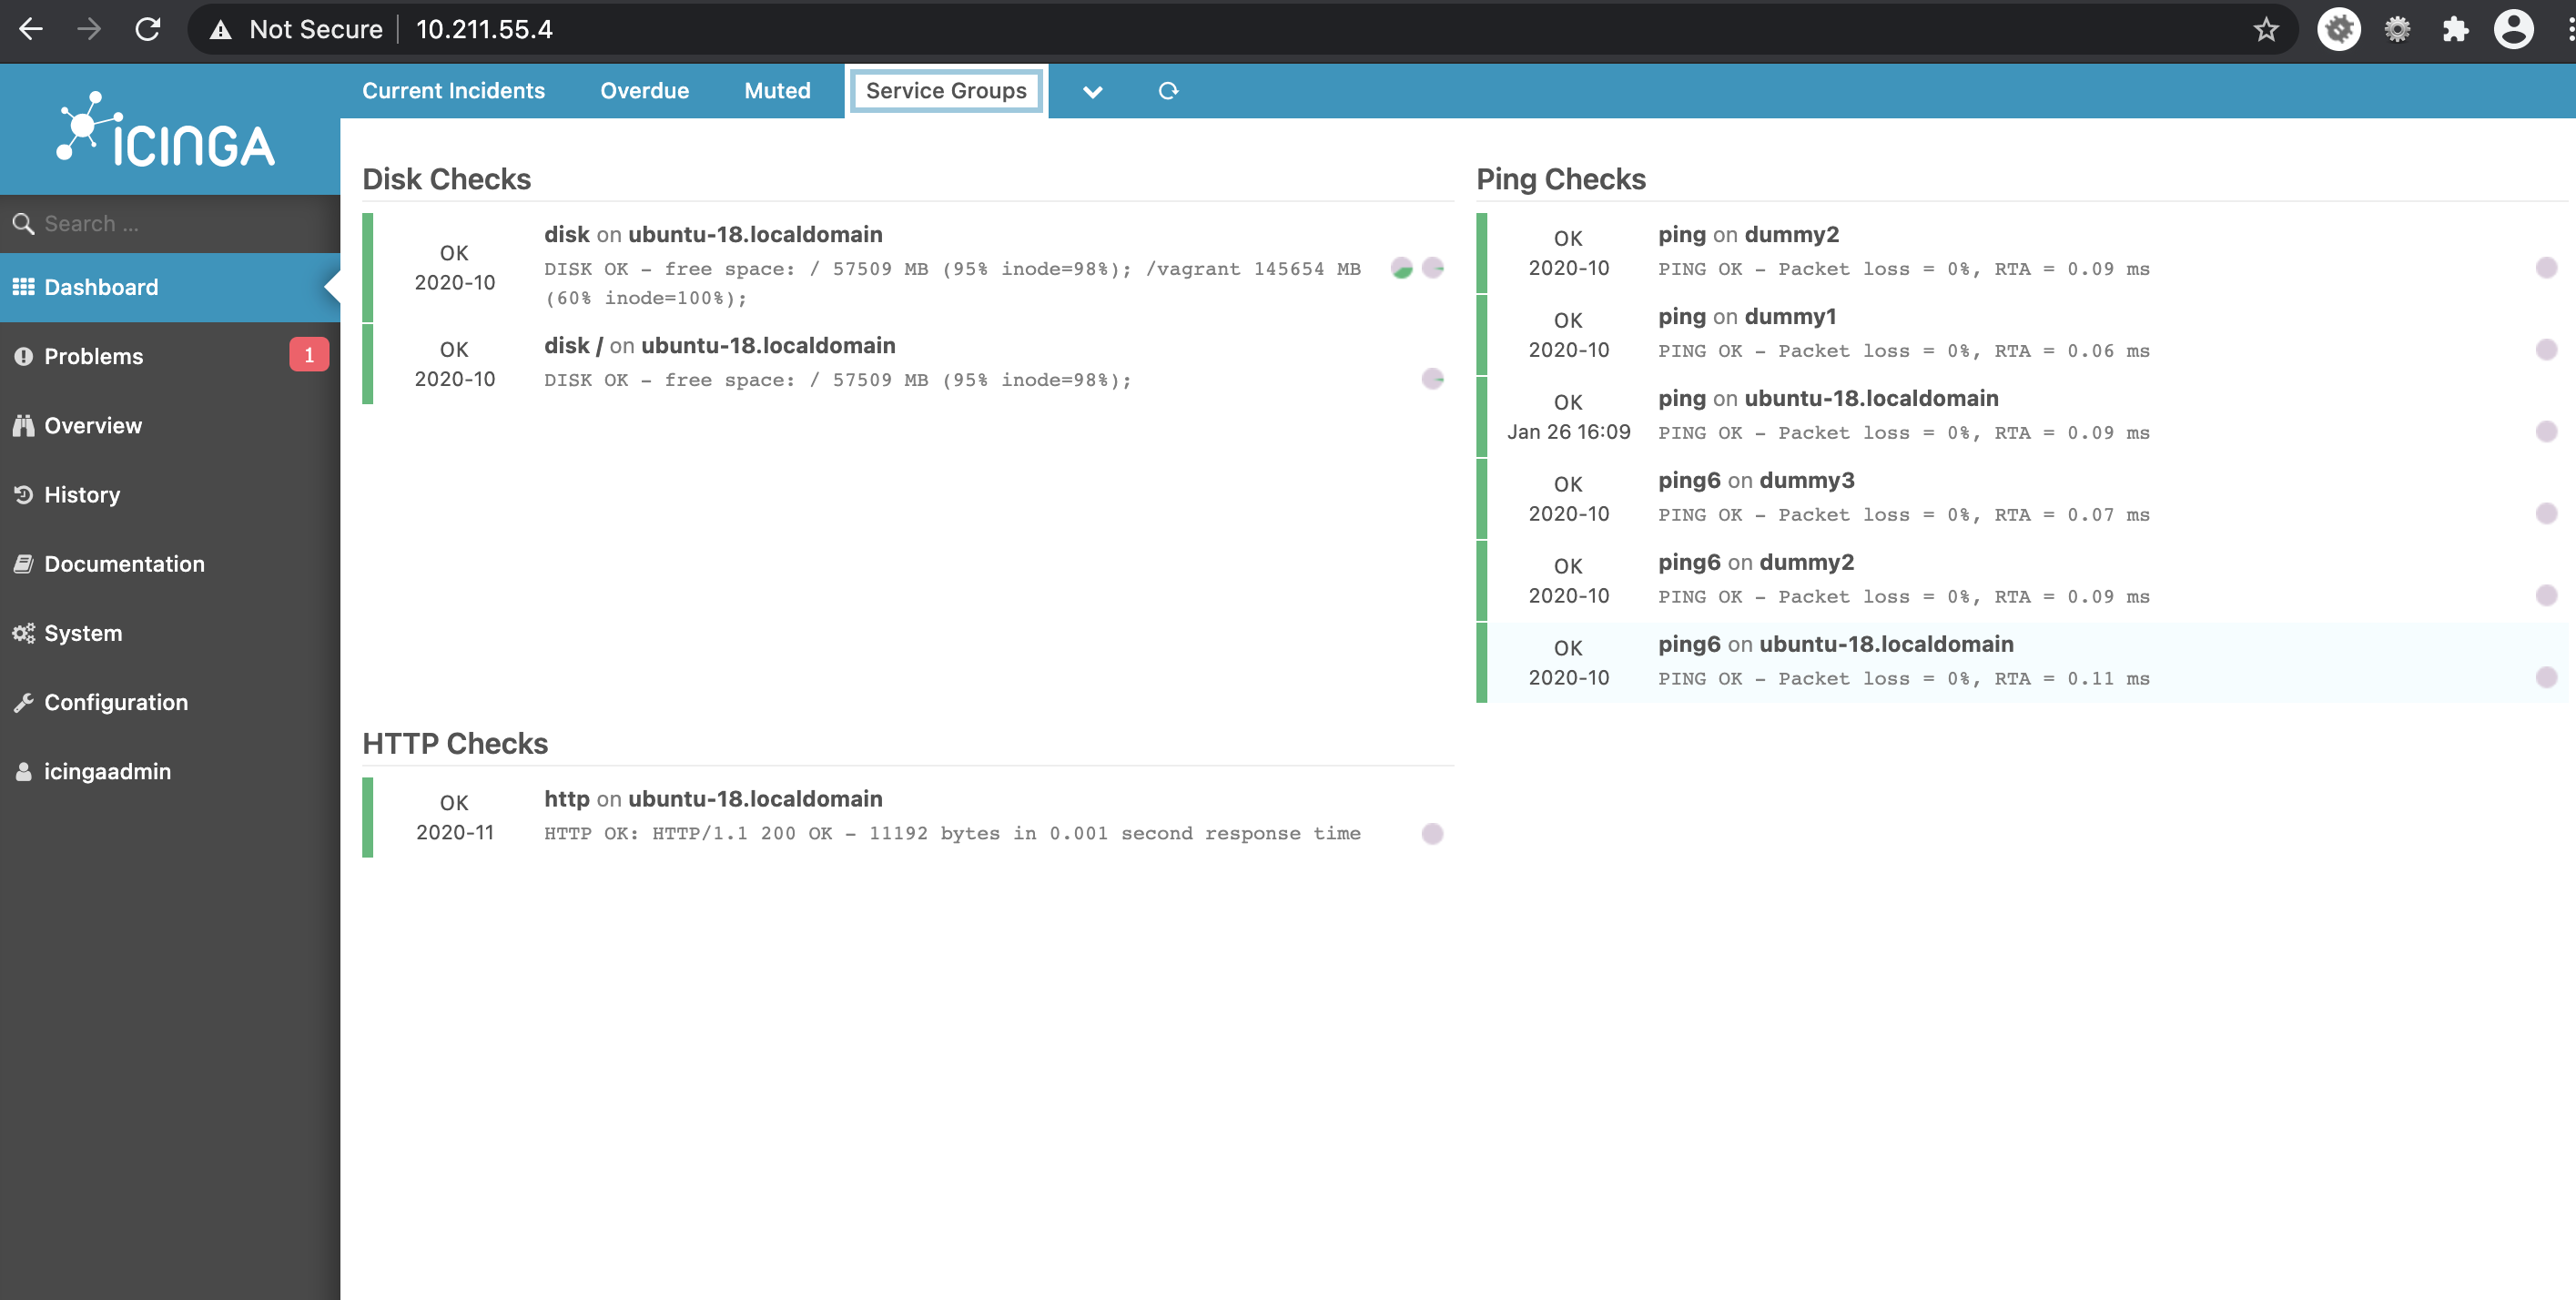
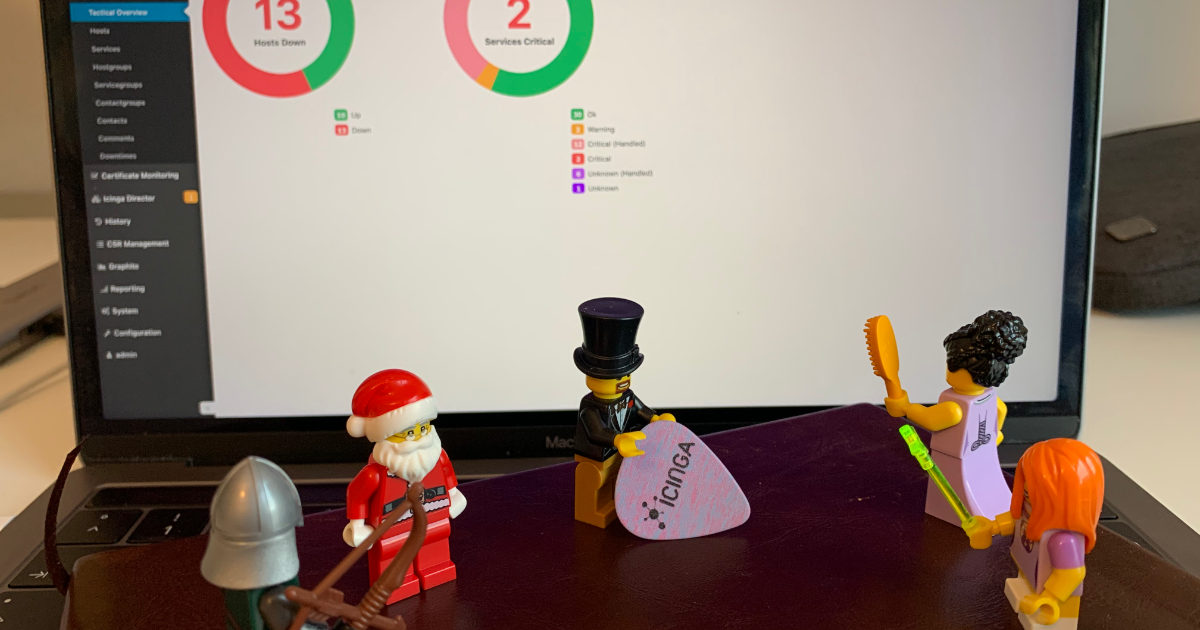
Creating dashboards based on custom filters
In this blogpost, I explain how to create dashlets using custom filters. This way you can create dashlets of your own which you find is necessary. Having dashboards in fact improves monitoring. Dashlets are the different sections under the given dashboard, which are...

Icinga 2 Config Sync: DIY Edition
Two weeks ago, Icinga 2 Config Sync: Behind the Scenes explained how the config sync in Icinga 2 works and how you can look behind the scenes. Today, we will put our knowledge from that post to the test and try to manually replicate the config sync. The most important...
Icinga for Windows – Hyper-V and Cluster Plugins Preview
Today we finally have great news to share for everyone using Icinga to monitor Hyper-V and Windows Cluster environments. For quite some time we've been working on multiple new plugins to provide better monitoring option for Hyper-V and Windows Cluster. The new plugins...

Subscribe to our Newsletter
A monthly digest of the latest Icinga news, releases, articles and community topics.
