Icinga Notifications custom sources enable you to extend your monitoring capabilities beyond standard configurations. One of the advantages of the new Icinga Notifications is that it is more loosely coupled to Icinga 2. This is made possible by the concept of sources, each of which is a possible provider of events for Icinga Notifications to act upon. While the most prominent source would be of the “Icinga” type, there is also the “Other” option, which opens up a huge field of different providers via a simple HTTP-based API.
This article will walk you through creating such a custom “Other” source and sending events to it. After starting with a simple example, we will move on to a more advanced one connecting Icinga 2 and Prometheus.
Creating A Custom Source for Icinga Notifications
Starting with a basic configured Icinga Notifications setup as described in the Getting Started article,you can expand its capabilities by creating Icinga Notifications custom sources. A second source will be configured through Icinga Notifications Web. By navigating to ⚙ > Modules from the left side menu, selecting the “notifications” module and following to its Sources tab, a new source can be created. For this example, we will name it “webhook”, set its type to “Other“, also set its type name to “webhook” and provide a password that must be have at least sixteen characters, as it is being enforced by Icinga Web.
Currently – Icinga Notifications v0.1.1 and Icinga Notifications Web v0.1.0 – the source ID of the just created source is required. Unfortunately, it is not displayed directly in the web UI and the daemon does not act on the source name. This behavior will most likely be fixed in a future release. For now, click on your newly created source and take a look at the URL that ends something like notifications/source?id=2 – this 2 is the desired ID.
Processing Events Via The API
At this point, we have all the information we need to create events. The only open question is what events actually are, which is fortunately explained in the HTTP API documentation. Following this text, and having taken a look at the expected event schema, an illustrative JSON payload can be sent via curl. Please use “source-2” – where 2 is the ID from above – as the username and the password you set using HTTP Basic Authentication.
As an example, consider an external door monitoring system that identifies doors by name. This system sends an alarm about an open front door by specifying the door through the required tags. Since this is a critical alarm, the severity is set accordingly.
curl -u 'source-2:clubmateclubmate' -d '@-' 'http://localhost:5680/process-event' <<EOF
{
  "name": "Front Door: State",
  "type": "state",
  "tags": {
    "door": "front door"
  },
  "severity": "crit",
  "message": "Door is left open!"
}
EOF
Either after some time, or after someone read the notification, the door was closed. So the door sends a resolving event that addresses the same door with an “ok” severity.
curl -u 'source-2:clubmateclubmate' -d '@-' 'http://localhost:5680/process-event' <<EOF
{
  "name": "Front Door: State",
  "type": "state",
  "tags": {
    "door": "front door"
  },
  "severity": "ok",
  "message": "Door is closed."
}
EOF
These two independent requests are enough to create Icinga Notifications events and an incident to track it all. This simple design will hopefully allow for multiple integrations, even down to simple programs running on small microcontrollers.
Trend Predictions Of Icinga 2 Checks Via Prometheus
Recently there was a discussion on the Icinga Community forum about trend predictions and how to do them in Icinga. Such a trend can be a steadily filling partition, where you need to know how much space will be left in the near future. While some may argue that having a WARNING or CRITICAL threshold is already some level of trend prediction, having a statistical extrapolation based on recent history is more accurate.
Checks evaluated in Icinga 2 lack the time dimension. That’s where time series databases come in, allowing predictions-based on past data. While Icinga 2 already supports some, a symbiosis of Icinga and Prometheus was attempted for this article.
As the small word “attempt” may indicate, the following is a thought experiment with a proof of concept. The intention is to showcase what would be possible. This is also the reason why this example is limited, which makes it not so attractive to be copy-pasted. However, if the following motivates you, feel free to use it as a foundation to build on.
Enough of the disclaimer, let’s draw up a blueprint for getting performance data from Icinga 2 to Prometheus and getting prediction-based alerts back:
- Export the necessary Icinga 2 metrics in Prometheus’ data model using a simple exporter.
- Configure a Prometheus to scrape that exporter and define alerts for our data.
- Have Prometheus forward these alerts to the Prometheus Alertmanager (this may have been skipped).
- Let the Alertmanager send the alert to Icinga Notifications via a web hook to a custom source.
Exporting Icinga 2 Performance Data For Prometheus
Data aggregation on Prometheus works a bit different than for Icinga. In a nutshell, metrics are being exposed by a HTTP web server in its exposition format. Prometheus will scrape this data and insert it into its internal time series database.
While there are exporters that a quick web search would reveal, a very limited one was written for this post. It queries the Icinga 2 API for all disk checks and converts the returned JSON to the desired format. All this is possible in a few cursed lines, understanding them is an exercise left to the reader.
#!/bin/sh

curl -k -s -S \
  -u "root:icinga" \
  -H 'Accept: application/json' \
  -X 'GET' \
  -d '{ "filter": "service.name==\"disk\"", "attrs": ["host_name", "last_check_result"] }' \
  'https://icinga2:5665/v1/objects/services' \
| jq -r \
  '.results[].attrs
    | { host: .host_name, perfs: [.last_check_result.performance_data[] | {perf: .}] }
    | .perfs[] += { host: .host }
    | .perfs[]
    | [.host, .perf]
    | @tsv' \
| awk \
  'BEGIN { split("value,warn,crit,min,max", perfValLabel, ",") }
   {
     fields = split($2, perfs, "[=;]")
     multiplier = match(perfs[2], /MB$/) ? 1000*1000 : 1
     for (i = 2; i <= fields; i++) {
       gsub(/[^0-9]/, "", perfs[i])
       printf "icinga2_perf_disk_%s_bytes{host=\"%s\",mount=\"%s\"} %s\n",
         perfValLabel[i-1], $1, perfs[1], perfs[i] * multiplier
     }
   }'
This script prints the metrics to standard output, and can be redirected to a file and served by a web server. Again, this is a proof of concept.
icinga2_perf_disk_value_bytes{host="example.com",mount="/"} 158334976
icinga2_perf_disk_warn_bytes{host="example.com",mount="/"} 965528780
icinga2_perf_disk_crit_bytes{host="example.com",mount="/"} 1086219878
icinga2_perf_disk_min_bytes{host="example.com",mount="/"} 0
icinga2_perf_disk_max_bytes{host="example.com",mount="/"} 1206910976
icinga2_perf_disk_value_bytes{host="example.com",mount="/usr"} 2249195520
icinga2_perf_disk_warn_bytes{host="example.com",mount="/usr"} 3619684352
icinga2_perf_disk_crit_bytes{host="example.com",mount="/usr"} 4072144896
icinga2_perf_disk_min_bytes{host="example.com",mount="/usr"} 0
icinga2_perf_disk_max_bytes{host="example.com",mount="/usr"} 4524605440
icinga2_perf_disk_value_bytes{host="example.com",mount="/home"} 32505856
icinga2_perf_disk_warn_bytes{host="example.com",mount="/home"} 965528780
icinga2_perf_disk_crit_bytes{host="example.com",mount="/home"} 1086219878
icinga2_perf_disk_min_bytes{host="example.com",mount="/home"} 0
icinga2_perf_disk_max_bytes{host="example.com",mount="/home"} 1206910976
Configuring Prometheus
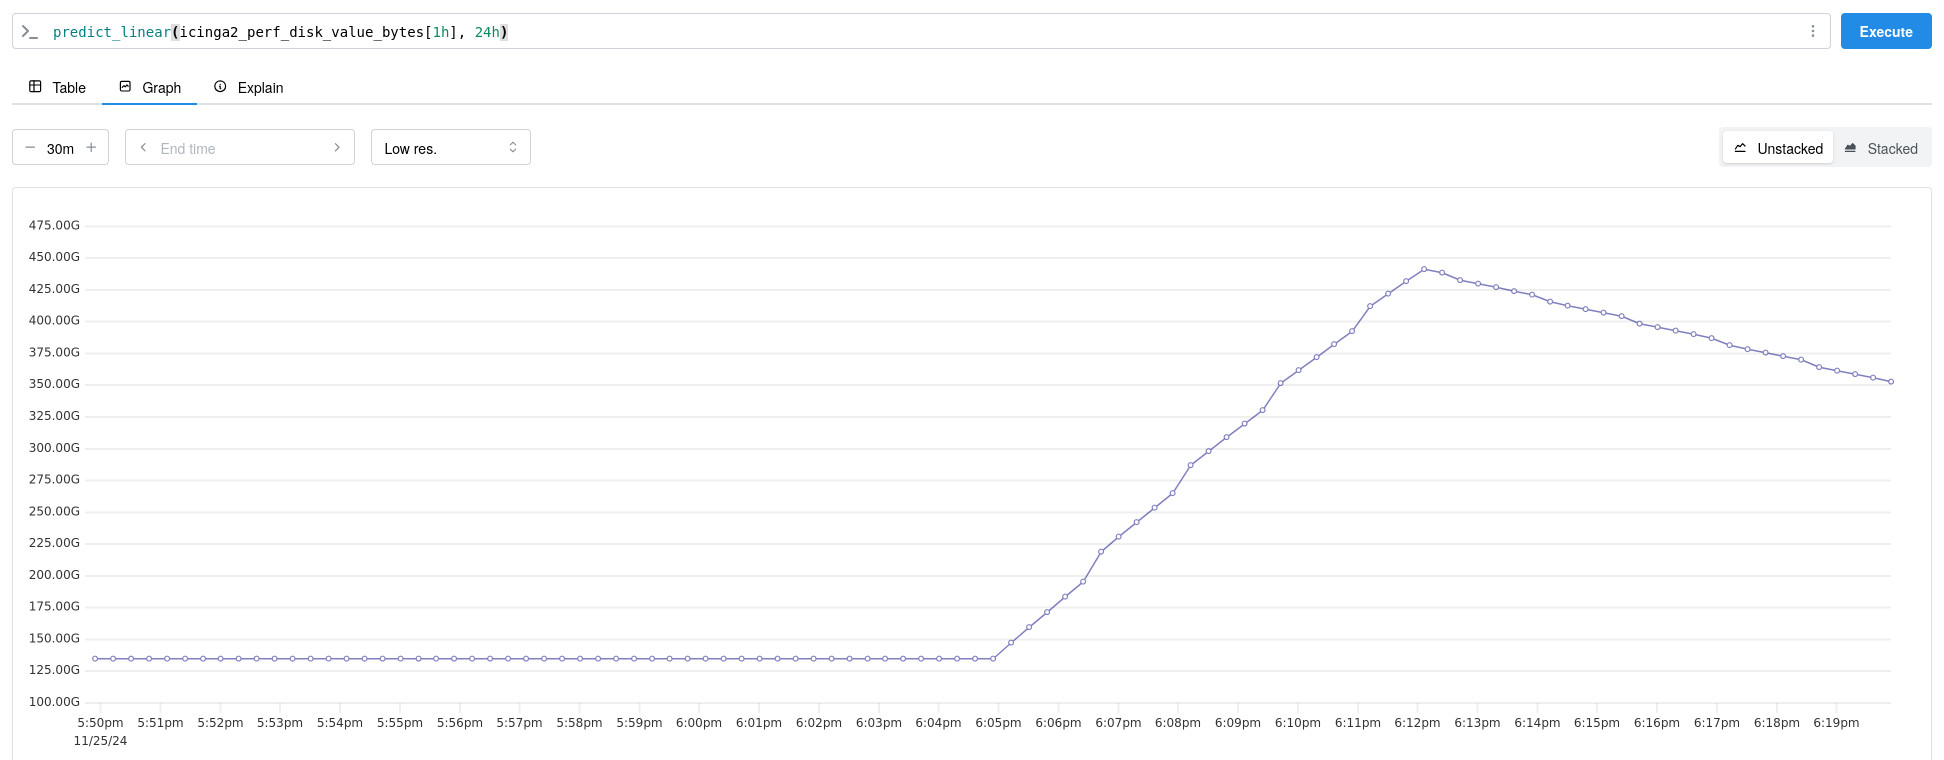
While configuring Prometheus is already well documented and out of scope, we are focusing on creating a trend-based alert. A simple linear prediction is possible by using Prometheus’ predict_linear function. In effect, this function extrapolates the development within a past time range up to a point in the future. Please note that linear extrapolation has its limitations.
groups:
- name: icinga_disks
  rules:
  - alert: DiskWarningIn24h
    expr: predict_linear(icinga2_perf_disk_value_bytes[1h], 24h) >= icinga2_perf_disk_warn_bytes
    for: 1m
    labels:
      severity: warning
    annotations:
      summary: "Disk {{ $labels.mount }} on {{ $labels.host }} will be warning in 24 hours."

  - alert: DiskCriticalIn24h
    expr: predict_linear(icinga2_perf_disk_value_bytes[1h], 24h) >= icinga2_perf_disk_crit_bytes
    for: 1m
    labels:
      severity: crit
    annotations:
      summary: "Disk {{ $labels.mount }} on {{ $labels.host }} will be critical in 24 hours."
If the monitored partition starts to fill up quickly, this alert will fire and we can see a linear prediction. So either check what is suddenly writing files or otherwise start shopping for more disks, many more disks.
Finally, Prometheus needs to be configured to forward alerts to the Alertmanager. Details are available in the Prometheus documentation and are not needed in this post.
Forwarding From Prometheus Alertmanager To Icinga Notifications
To close the loop, the Prometheus Alertmanager needs to pass alerts back to Icinga using Icinga Notifications. While both the Alertmanager can send alerts to a generic webhook and Icinga Notifications can consume alert events via HTTP, there is of course a mismatch in formats. So a little middleware has been written that consumes the alerts from the Alertmanager and forwards them to Icinga Notifications in the expected format. The source code is of course available.
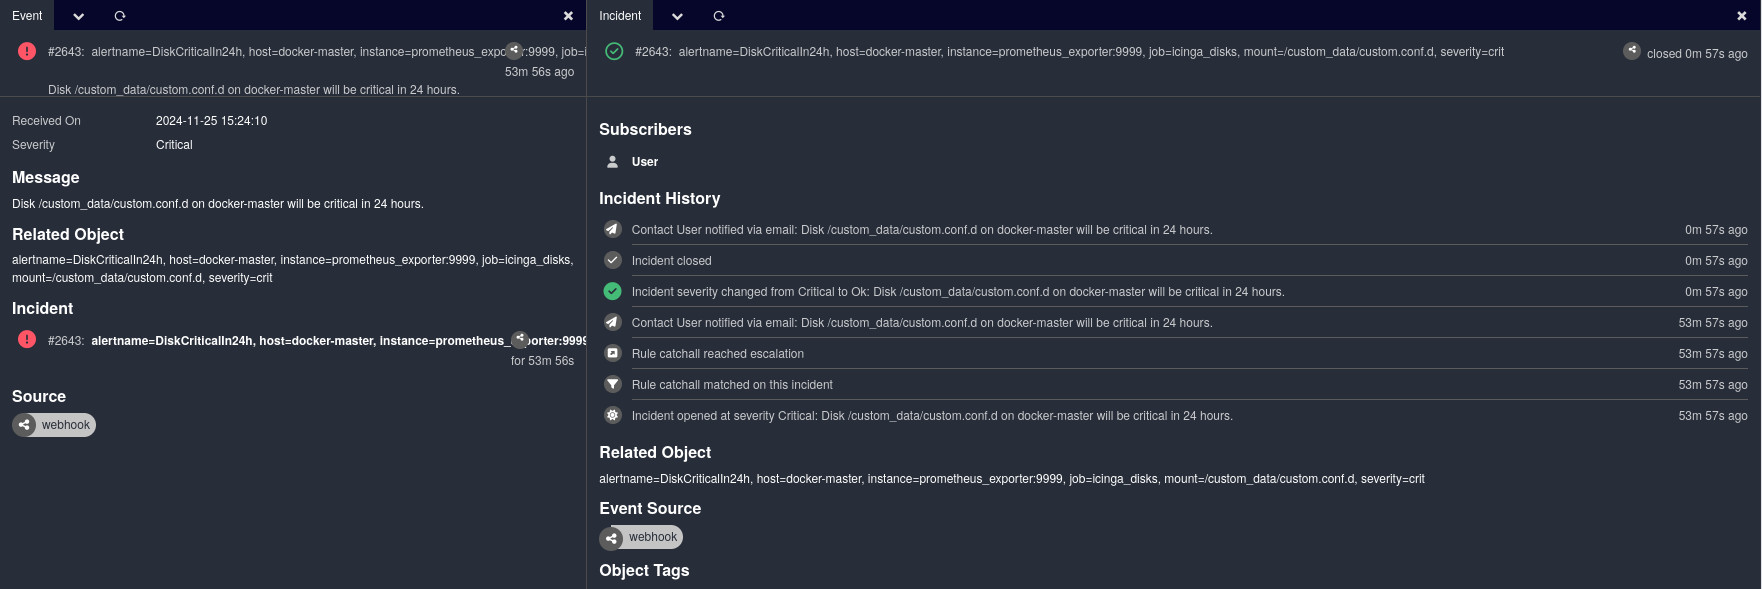
Finally, the alerts have reached Icinga Notifications, resulting in events and incidents being created there.
Going Further
As these two examples may have shown, it is quite easy to integrate external notification sources into Icinga Notifications. So if this fits your setup, you might want to take a look at Icinga Notifications instead of creating a placeholder Icinga 2 checks to pipe notifications through. Supporting is already coming for other new Icinga projects, such as Icinga Kubernetes.


