If you want to get started with Icinga but don’t have a data center lying around, no worries. Icinga is a lightweight monitoring tool that works for both large infrastructures and small home labs.
When I first explored Icinga during my first year as an apprentice, it was also my first real contact with monitoring tools. After completing the Icinga Fundamentals training, I wanted to experiment with hosts and services, but what should I monitor?
I had recently set up a small Nextcloud server with a local IP address to store backups. Since it runs without a UI, I always had to connect via SSH to check updates or system status. It felt a bit oversized, but also like the perfect opportunity to learn Icinga while monitoring a real server.
So, let’s start.
Setting up the Icinga Master and Host
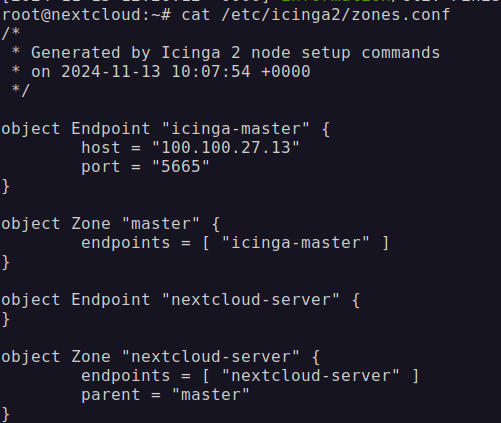
I installed the Icinga master on a virtual machine running on my laptop. Communication between master and client was handled through a VPN (WireGuard-based Tailscale).
Following the official documentation, I installed:
- Icinga 2
- Icinga DB
- Icinga Web 2
I used the Director as the configuration interface. I enabled the Icinga 2 API, completed the Icinga Web 2 on-boarding wizard, and connected the Director to the database. It’s important to review firewall rules and open the required ports and IP addresses so the master and web interface are reachable.
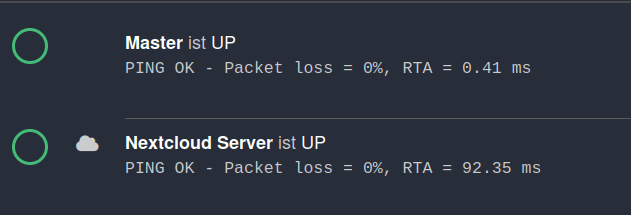
At this point, I could start configuring the monitoring setup. I created a master host on the localhost address to see its status in the overview menu. Next, I created a host for the Nextcloud server and used the Tailscale IP address of the server to connect it.
To monitor the host, I needed to install the Icinga agent. The agent performs local checks and sends results to the master. Icinga handles secure communication through certificates. For details, see the official documentation:
https://icinga.com/docs/icinga-2/latest/doc/06-distributed-monitoring/
Implementing Check Plugins and Services
Once the agent is connected, monitoring services can be assigned to the host. Disk checks were an easy win, and suddenly I could actually see what was happening on my server without logging in manually.
Disk Monitoring
Disk usage checks are useful for nearly any server environment. They provide insight into free storage, warn about critical usage, and allow monitoring of specific partitions.
Plugins:
disk_cfree– triggers a CRITICAL state when free space is below a thresholddisk_wfree– triggers a WARNING at configurable levelsdisk_megabytes– reports available space in MBdisk_partitions– monitors selected paths
In the Director, these checks are typically added via a service template and applied directly to the Nextcloud host. Next, I added an update check on both master and host.
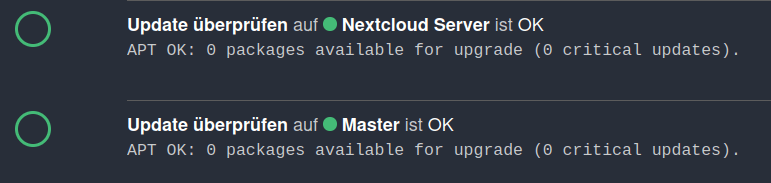
Update Monitoring
Keeping a server up to date is essential. An APT-based update check (check_apt) evaluates whether new updates are available. The plugin can be scheduled to run periodically (for example every 12 hours) to provide continuous insight into the update status.
I added a few more useful plugins to gather information about my Nextcloud server.
HTTP Monitoring
For web-based services such as Nextcloud, the check_http plugin can verify whether the web interface is responding.
Network and SSH Availability
A simple ping-based service can confirm whether the host is reachable: check_ping. Similarly, an SSH check ensures that the server responds on its SSH port.
CPU Load
CPU load can also be monitored to gain insight into the system’s overall performance. The check_load command provides the system load averages over the last 1, 5, and 15 minutes and can be added to the host like any other service.
Adding External Plugins for RAM and Apache
Icinga supports a wide range of external plugins, which can extend monitoring with additional metrics. Plugins for RAM usage or Apache status checks can be downloaded from GitHub or Icinga Exchange and placed into the following directory:/usr/lib/nagios/plugins/contrib
After downloading, the plugins must be made executable. Some plugins require data fields to be defined in the Director. For RAM monitoring, fields like free_ram or used_ram
determine what the plugin evaluates. Since inherited values default to no, at least one field must be set to yes for the plugin to operate correctly.
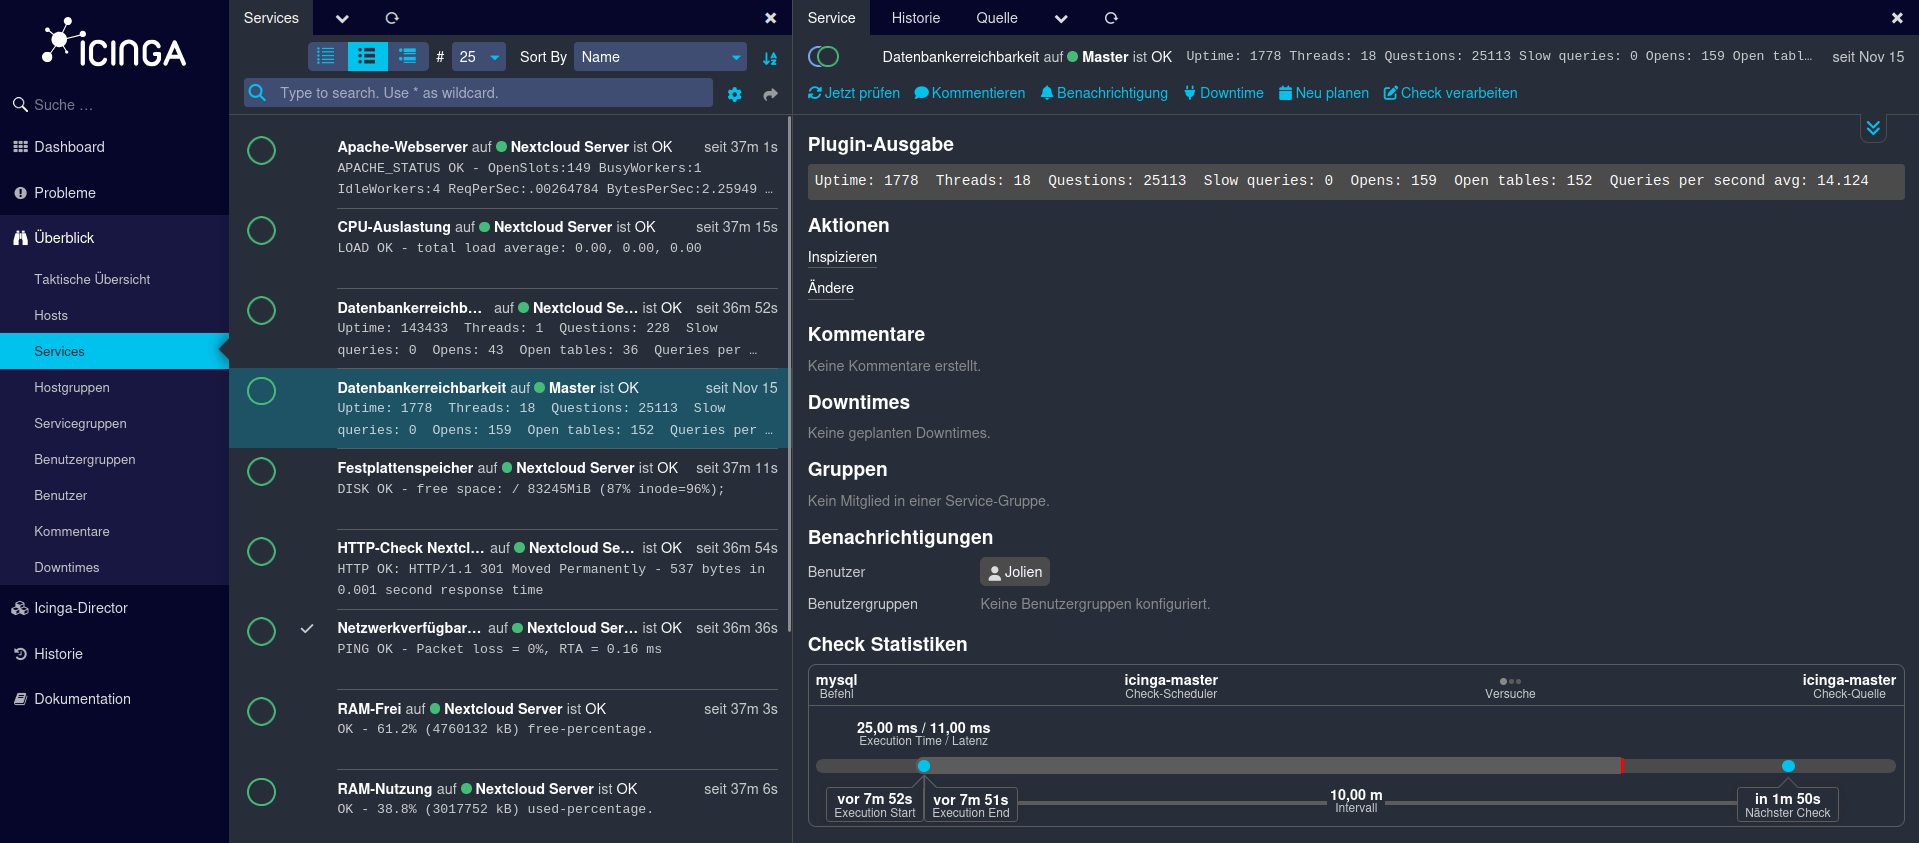
Troubleshooting the Icinga Database
The Icinga database is a crucial component for both the Nextcloud host and the Icinga master. Even though the database plugin is usually easy to integrate, I quickly ran into some connection errors.
![]()
![]()
![]()
![]()
The first error indicated missing or incorrect database user permissions. Adjusting the user privileges in MariaDB solved this.
GRANT ALL PRIVILEGES ON *.* TO 'nagios'@'localhost' IDENTIFIED BY 'nagios';
FLUSH PRIVILEGES;
Then another error popped up, this time on the host. It couldn’t connect to MySQL because the IP address wasn’t allowed. This was fixed by adding the correct IP address to the Nextcloud server’s configuration file.
cd /etc/mysql/mariadb.conf.d vi 50-server.cnf
# add the IP address in 50-server.cnf
bind-address = <IP-address>
I also had to adjust the user privileges and update the firewall rules so the IP address could access MariaDB on port 3306.
GRANT ALL PRIVILEGES ON *.* TO 'nagios'@'<IP-address>' IDENTIFIED BY 'nagios'; GRANT ALL PRIVILEGES ON *.* TO 'nagios'@'nextcloud.tail8d86d.ts.net' IDENTIFIED BY 'nagios'; FLUSH PRIVILEGES;
Once everything was up and running, the monitoring gave me some really cool insights into my server.
Conclusion
Even with just a small Nextcloud server and a simple virtual machine running the Icinga master, I was able to explore a wide range of monitoring capabilities. From disk usage and update checks to network availability, HTTP responses, database connectivity, and additional RAM or Apache monitoring, this setup gave me an accessible yet powerful introduction to Icinga.
Through this project, I learned how hosts, agents, services, and plugins interact, and I gained a practical understanding of how to build a functional monitoring setup for my home server. The final dashboard visualized all collected checks on my Nextcloud host and clearly showed a complete, working monitoring environment.
Working on this project not only helped me understand Icinga’s components, it also sparked my enthusiasm for Icinga and monitoring.
If you want to explore these features yourself without setting up everything locally, try the Icinga demo.