We are releasing Icinga TOTP Web v1.0.0, which adds Time-based One-Time Password (TOTP) two-factor authentication to Icinga Web. What Is Icinga TOTP Web? Icinga Web's authentication system supports...
Icinga TOTP Web 1.0.0 Release
We are releasing Icinga TOTP Web v1.0.0, which adds Time-based One-Time Password (TOTP) two-factor authentication to Icinga Web. What Is Icinga TOTP Web? Icinga Web's authentication system supports...

Features in Icinga Web 2 Worth Knowing About
When you work closely with Icinga Web 2, developing modules, building dashboards, poking around the internals, you naturally pick up on features that most users never think about. Some are usability improvements that deserve more attention than they get. Others are...
Monitoring Docker Containers with Icinga
A container reporting "up" tells you the process is running, not that the workload is healthy - but that caveat is true of any service, on a container or a bare server. What makes containers their own monitoring problem is the layer around the process: per-container...
IPL: How to use the ipl-web TermInput
Most form fields ask users for a single value like a name, an email, or a date. But some need a list of values. A plain text input with comma-separated values can technically do the job, but it gives no feedback while typing, no suggestions, and one invalid entry...

How to Create Your Own Plugins and Check Commands in Icinga 2
If you've been using Icinga 2 for a while, you probably know the built-in checks cover a lot of ground: disk space, CPU, memory, ping. But sooner or later you'll run into something specific to your setup that no existing plugin handles. That's where writing your own...

Tips and Tricks for Handling Secrets in Icinga 2
Today, we are going to look at a few things related to handling secrets. While Icinga 2 has no dedicated mechanisms for secret handling, there are a few tricks you can do with standard features. This is not meant as a step-by-step tutorial, but rather as an...
Get Valid TLS Certificates for Icinga Web Despite a Firewall
Lots of big companies lock down their IT infrastructure in the internal network, sometimes they even use only locally mirrored repositories. I totally understand this, especially since our CVE-2024-49369. Nowadays, when LLMs find security holes even in OpenBSD, you...

Icinga 2 Meets OpenTelemetry: Native Metrics Export in v2.16
The OTLPMetricsWriter is a new Icinga 2 feature available since v2.16 that exports check plugin performance data as OpenTelemetry-compliant metrics via the OTLP HTTP protocol. With a single configuration object, it connects Icinga 2 to any OTLP-compatible backend like...

Mirroring Icinga Packages in Air-Gapped and Restricted Environments
When hosting in a secure or corporate environment, Internet access is often restricted or blocked completely. While this makes sense from a security point of view, this introduces some challenges. For one, getting software packages. There are usually two approaches to...
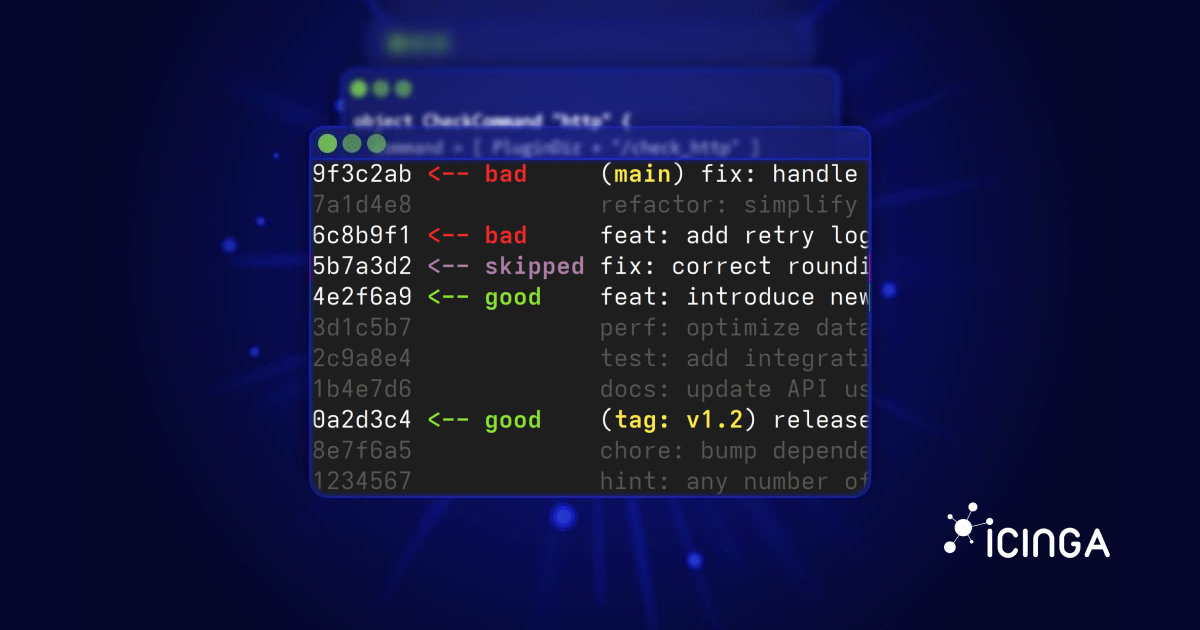
How to Use Git Bisect to Pinpoint Bugs Precisely
A feature that used to work suddenly broke. The problem? There were 300 commits since the last time I knew it worked. Checking each commit manually would take forever. Fortunately, Git has a tool designed exactly for this situation: git bisect. What is Git Bisect? The...
Syncing LDAP Users & Groups with the Icinga Notifications Web API
If you're running Icinga in a mid-to-large organization, chances are your users and teams are already defined in LDAP or Active Directory. Manually re-creating contacts and contact groups in Icinga Notifications Web is tedious and error-prone, but thankfully, it...

How to undo Git reset hard?
You just finished a long interactive rebase. You hit enter. Your commit history looks… wrong. There is a bunch of things that could go wrong: messed up an interactive rebase accidentally ran git reset --hard merged the wrong branch rebased onto the wrong base You...

Subscribe to our Newsletter
A monthly digest of the latest Icinga news, releases, articles and community topics.
