If you’ve ever onboarded a teammate at 4:57 PM on a Friday (or offboarded one at 4:58 PM… ), you know the pain: keeping notification contacts and groups up to date is work. With the Icinga...

Sync Your Users Into Icinga Notifications: Introducing the Contacts/Groups API
If you’ve ever onboarded a teammate at 4:57 PM on a Friday (or offboarded one at 4:58 PM… ), you know the pain: keeping notification contacts and groups up to date is work. With the Icinga...
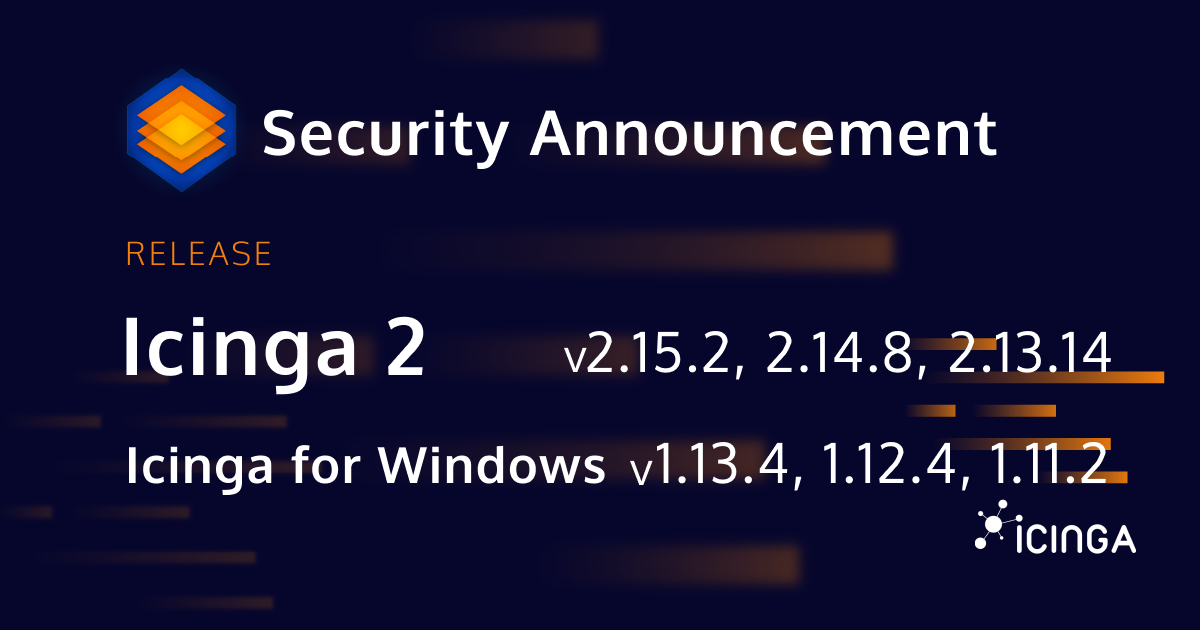
Releasing Icinga 2 v2.15.2, v2.14.8, v2.13.14 and Icinga for Windows v1.13.4, v1.12.4, v1.11.2
Toady, we are releasing multiple new versions of Icinga 2 and Icinga for Windows, all of them fixing a file permission issue present in all installations on Windows. Impact The following paths were created without setting proper permissions, allowing all local users...

SolarWinds Alternative: Why Icinga Is the Open Source Option for Scalable Infrastructure Monitoring
Searching for a SolarWinds alternative usually happens at a turning point. For some organizations, it starts with a renewal quote that exceeds expectations. For others, it follows a strategic review of vendor risk, subscription lock-in, or long-term monitoring costs....
Unmasking SVG Injection: Behind the Scenes of Web Graphics
Have you ever admired those cool graphics on the web? They look nice but can be the wolf in sheep's clothing. In this post you will learn about SVG injections and how to avoid them. What is SVG? Before we get into the topic of SVG injection, let's understand SVG...
Unleashing the Potential of SVGs: A Guide to Dynamic Visualization and Monitoring
Introduction In the dynamic realm of monitoring Kubernetes clusters, effective visualization is paramount for gaining insights into system health and performance. One versatile tool that has gained prominence in this domain is Scalable Vector Graphics (SVGs). In this...
Icinga DB Web migration made easier
For users using monitoring module, migrating their custom dashboards, navigation items and permissions and restrictions to Icinga DB Web has been made easier with the recent Icinga DB Web release (v1.1.1) through its migrate command. Once Icinga DB Web has been...
Top 3 Icinga Components You Can’t Ignore
Monitoring your systems is like having a superhero keeping an eye on your digital realm. And when it comes to superheroes in the world of monitoring, Icinga takes center stage. But did you know that Icinga becomes even mightier with the help of components? In this...
Elevate Your IT Service Offering with an Official Icinga Partnership
In the dynamic landscape of IT services, staying ahead of the curve is not just a strategy but a necessity. For IT service providers already consulting clients on monitoring solutions, taking the next step to engage in an official partnership with Icinga can be a...
Why infrastructure monitoring is important
In today's technology driven world, businesses rely heavily on their digital infrastructure to operate efficiently and serve customers effectively. With the growing complexity of these infrastructures, ensuring their stability and performance has become paramount....
Releasing Icinga Ansible collection v0.3.0
This release of the collection will feature a whole set of possibilities to deploy a complete Icinga 2 environment. Before diving deep into the collection, a quick recap of all roles which were available and which are included in the current release v0.3.0. repos: The...
Content-Security-Policy: How to add inline CSS to HTML Documents in Icinga Modules
Since the Icinga Web 2.12 release we have added a setting to enable content security policy in Icinga Web. This provides security against Cross-Site Scripting (XSS) attacks when the setting is enabled. This is done by adding Content-Security-Policy in our HTTP...
What are infrastructure monitoring metrics?
Nowadays businesses rely heavily on robust and resilient infrastructure to deliver uninterrupted services to their customers. This includes things like servers, databases, and cloud-based systems. It's important to monitor the health and performance of this...

Subscribe to our Newsletter
A monthly digest of the latest Icinga news, releases, articles and community topics.


