When setting up new monitoring software or migrating, it’s important to have a strong backbone in place for the systems, so you can cover as many services with as little manual burden as possible.
Of course, defining the resources – like HTTP, SSH, etc. services or entire host systems – is one of the first things that comes to mind.
Real-Time Monitoring and Notifications
When everything is defined and is being regularly checked every few seconds to monitor with an all-green dashboard, let’s make sure we know when something went wrong. Alerts/Notifications are the easiest solution for this, there are many options for this, for example, e-mail or SMS.
System Health and Performance Metrics
Now with all the services and hosts in our monitoring system, it’s important to monitor some key parts of services for example. CPU, Memory, and I/O are some basic aspects that should be monitored. This becomes crucial, for example, when a web service is slow to respond in a cluster, and we need to quickly determine which service is using a particularly high amount of CPU or Memory. These are the easy problems, but even in this case, much time is saved on the contrary to ssh into every host and scrolling through top. With this setup, it’s also easier to identify the relationship between outages/latency spikes and services. This aids in isolating the root cause. For example, if the web app is connected to a SQL Database that is having problems, thus holing up the web app.
Integration Capabilities
When implementing monitoring, it’s often into existing infrastructure where other tools are being used to automate tasks, for example. This makes integration from the monitoring side very important, to capture all the available data. Having options is the key here because not everyone is using the same tools and maybe in the future a different tool is being deployed in the infrastructure, which also needs integration. For this, a broad selection of integration with tools is necessary. Have a look at our overview of which we support.
Detailed Reporting
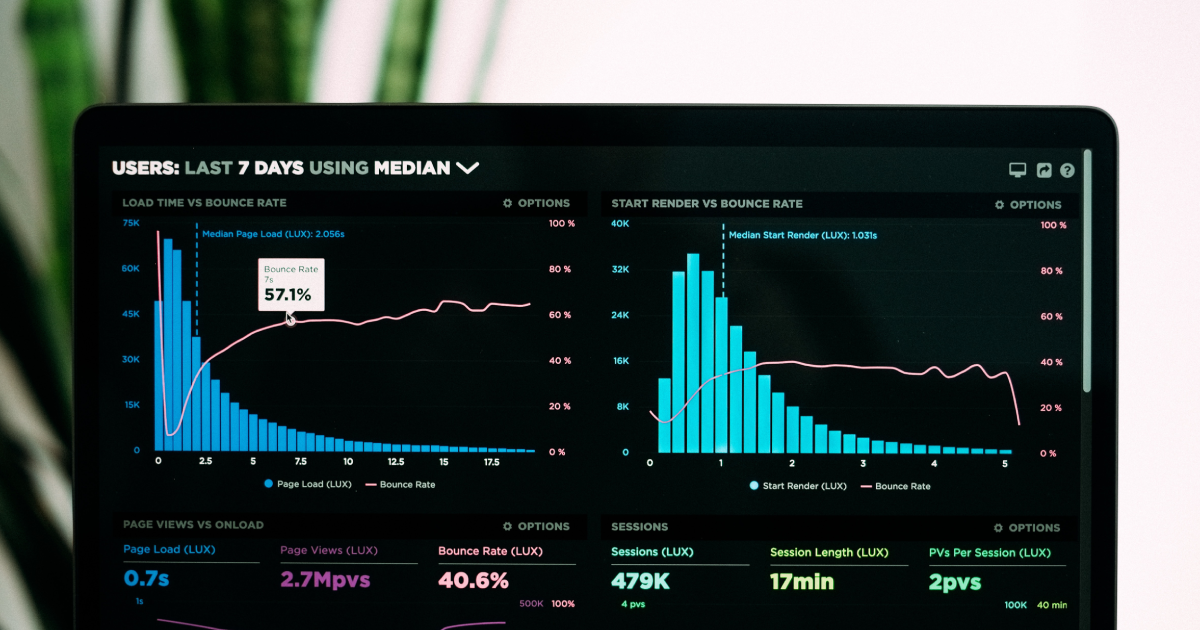
For reporting, data is paramount to understanding why issues are occurring. For example, when working with many microservices, a wrong-configured blocking cron job could send huge latency through the whole system. For these cases and many more, a detailed history for every service is needed to trace back or detect trends when latency spikes are happening. These tools are irreplaceable in your tool belt.
For more information, have a look at our Infrastructure monitoring page.


