To speed up startup and reload times of Icinga 2, we have already put a lot of effort into improving the configuration load performance and still continue to do so for the next major release. In this blog post, I will share the story of one particular issue we found, how we addressed it and what impact this has.
That Does Not Look Right
Sometimes there are situations where you don’t know what is wrong, but you are certain that something is wrong. That’s what occurred to me when I looked at htop while loading a large config on a big machine with many CPU cores, which looked like this:
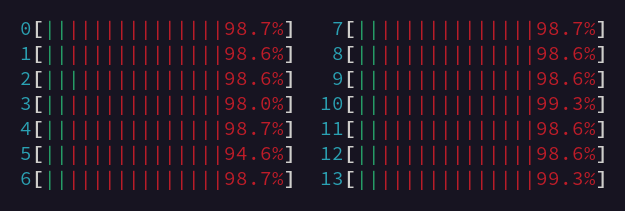
If you are not familiar with htop or always wondered why these bars are so colorful, let me explain it. The green part (10% in the screenshot) is user CPU time, that is how long the CPU executes user application code. Whereas the red part (90% in the screenshot) is system CPU time, which is the time the CPU is executing kernel code. This includes kernel code executed on behalf of applications, like in a system call. If you did not ask the kernel to do something expensive, like for example pushing lots of data through a VPN connection that handles the encryption inside the kernel, this is rarely a good sign.
What Is Going On Here?
So the obvious next step to take is to figure out what’s going on here. Some profiling of Icinga 2 showed that much time is spent in futex(2), a system call that is used to implement fast userspace mutexes. If your application is built to utilize multiple CPU cores, you have multiple threads of execution running in parallel. In this case, you have to ensure that these threads don’t perform conflicting operations. This is commonly achieved by preventing multiple threads to do these operations at the same time, which is called locking or mutual exclusion, mutex for short. And now it looks like Icinga 2 is doing a lot of it in a way that doesn’t look very good.
Now we have figured out roughly what is happening, but not where exactly and why. However, with some knowledge of the Icinga 2 internals, this was enough information to make an educated guess, which turned out to be correct in the end: you can use namespaces in your configuration and this uses a shared implementation that also used to expose namespaces like System or Types to the configuration. This is how you can access built-in functions like match().
These namespaces can be modified, so the implementation has to ensure that if one thread does that, this poses no risk to any other thread operating on the same namespace. Currently, this is implemented in the simplest way possible: any operation on a namespace acquires an exclusive lock, preventing any other operation at the same time. This means that with more threads, it becomes more likely that another one is already accessing a frequently used namespace like System and other threads have to wait. When this happens, the kernel switches to another thread which is a relatively expensive operation and in this situation, it is happening a lot.
What Do We Do Now?
The first important insight is that even though namespaces can be updated all the time, most of the time, values are just read. And it is perfectly safe for multiple threads to read from the same data structure at the same time as long as there is no thread writing to it. Indeed, this is common enough that most programming languages provide a synchronization primitive for exactly this: typically it is called a read/write lock or a shared mutex.
Another insight is that namespaces like System are actually populated once and not updated anymore afterwards. So if we can guarantee that no more updates happen to some namespace for sure, no synchronization is required at all to access it.
So we tried out a few options and settled on a pull request taking both those insights into account. Most operations now only acquire a shared read lock, allowing them to immediately acquire the lock and continue running in most situations. This results in a significant improvement for all namespaces. For the namespaces provided by Icinga 2 itself, their contents are frozen at some point, allowing following reads without acquiring any lock. This gives an additional small improvement for these namespaces because not acquiring any lock is still a bit cheaper then acquiring a read lock.
The Results
You can have a look at the pull request for some benchmarks of different approaches. For this blog post I decided to do something different as it show the impact of the change quite impressively. I built a small configuration that spends lots of time accessing namespaces by having an excessive amount of apply rules that create almost no objects. This means most time is spent evaluating the condition in the assign clause just to conclude that no object has to be created. I then ran a config validation for this config on a quite beefy machine (28 cores, 56 threads) and plotted the CPU usage for versions before and after this PR.
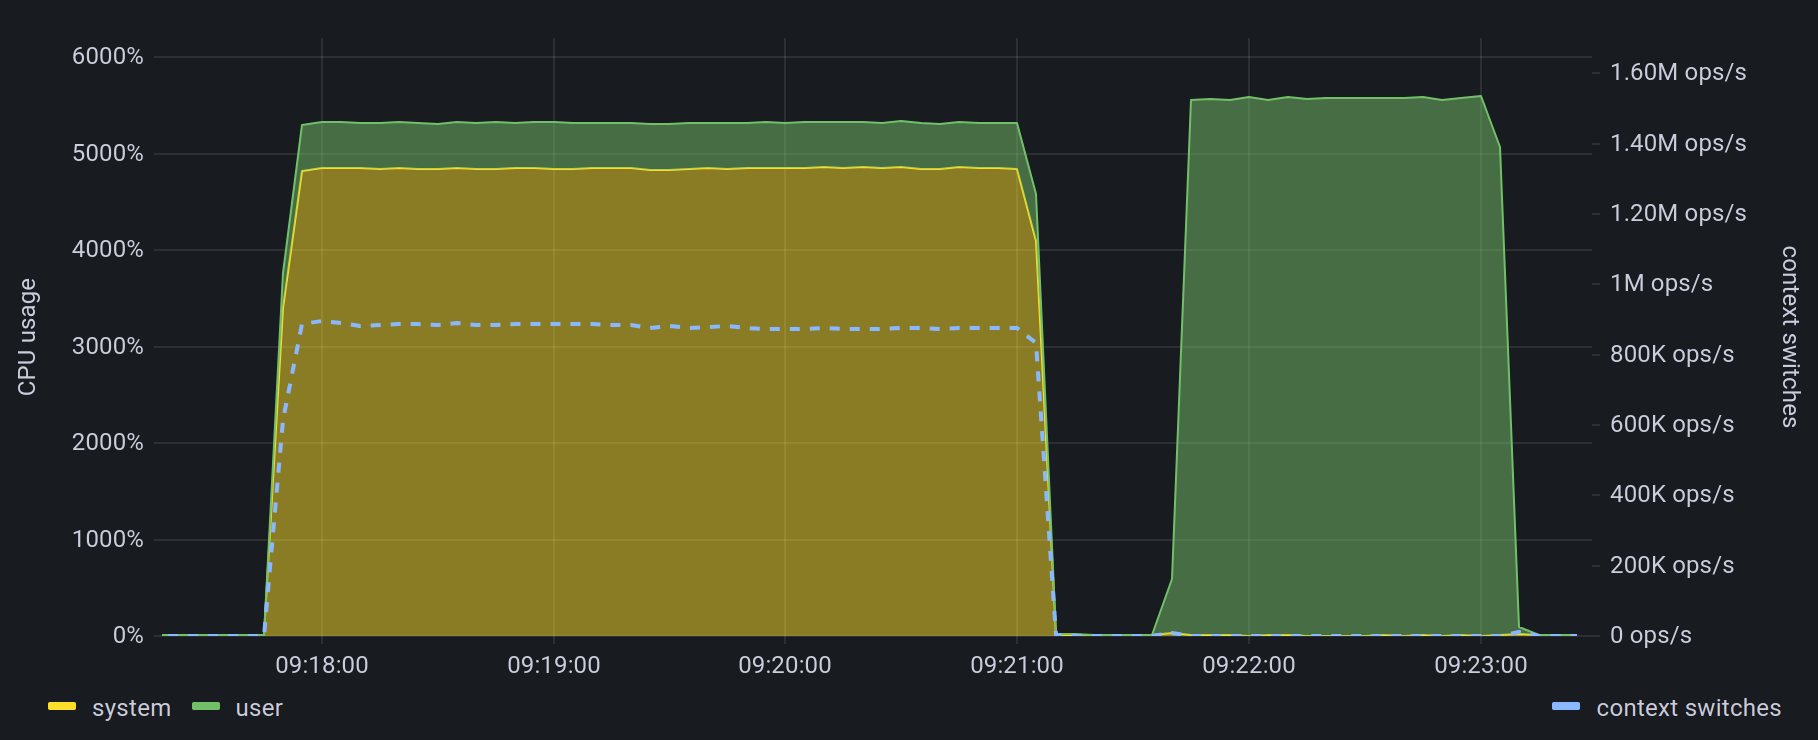
The left bump is the old version where you can see that most CPU time is spent inside the kernel (yellow) whereas only a small part is spent in the actual application code (green). Additionally, I plotted the number of context switches which correlates to the number of times the kernel switches to a different thread (blue dashed line, right axis). This reached ridiculous values of almost a million switches per second in this scenario. The right bump is the new version. The most impressive change is that the overall config validation took only about half the time it did before. Both the system CPU time and the number of context switches went down to such low numbers that they are hard to tell apart from zero in this graph.
Of course, the exact impact of this change depends on the individual configuration and the specifications of the system Icinga is running on. The numbers shown here are from a configuration that was tailored to show the effect and obtained on a machine with more cores than most Icinga installations are probably running on, so please don’t expect everything being twice as fast for you in the future. On the other hand, this is not the only performance improvement that will be coming in Icinga 2.14, so an improvement like this is also far from impossible. Only trying it out will give you the exact numbers so I hope you’re now looking forward to the upcoming 2.14 release as much as I do.
If you want to dive in deeper, and maybe contribute some improvements yourself, hop over to our Contributing starter guide on GitHub!