It has been a while since we published some news regarding Icinga for Windows – that’s why we would like to tell you one month ahead about a big change which follows with version 1.10 in August.
The Long Journey
Since the first release of Icinga for Windows including all available plugins for Windows, MSSQL, Hyper-V and Cluster we ensured that Performance Metrics were written alongside the plugin output, as expected within an Icinga environment. We also encouraged users and developers to use our PowerShell Framework as base for new Windows plugins, allowing an easier integration and development process. For this reason our Plugin Development Guide was written.
However, as time went on more and more users including ourselves had one challenge to master: How do we visualize the Performance Metrics Icinga for Windows is collecting?
The Challenging Naming
For Icinga for Windows we tried to provide a generic approach, ensuring that regardless of development skill available, the result will always look the same and provides performance data automatically generated by our Framework. The entry point was easily adopted and even made our inhouse development a lot easier and quicker.
The big challenge however is on how to integrate these Performance Metrics back into InfluxDB as example to visualize them inside Grafana. While both solutions provide a very strong engine to build queries, views and filters, the structure of the named labels made it impossible to properly receive adequate results. As example:
‘free_space_partition_c’=10328260000B;;;0;491811100000
At first look, we can easily filter for free_space_partition_ to receive the partition c. But we change the behavior of the plugin to report the used space instead of free space, the entire label will change:
‘used_space_partition_c’=481483000000B;;;0;491811100000
Of course we can provide different filters inside Grafana for this, is however even more challenging for more complex plugins. In addition, we cannot tell for sure which template we would want to use to include them and could result in an entirely different plugin, using a similar label name, to cause chaos within our visualization.
Multi Output For The Win
To improve this entire behavior and to make later filtering in Grafana easier, we will introduce a breaking change with Icinga for Windows v1.10.0: Multi output label naming.
By using Performance Metric label names followed by check_multi, we can provide a better structure for performance metrics, allow easier filtering and template usage. If we take a look on our previous metrics, the new labels much easier to work with:
‘c::ifw_partitionspace::used’=480627800000B;;;0;491811100000
‘c::ifw_partitionspace::free’=11178000000B;;;0;491811100000
The new label naming scheme will make use of an index, a template and the metric name. While the index should be set as the umbrella object we want to filter for (in this example c), the template as the check being executed within the ifw_ namespace (in this case ifw_partitionspace) and the actual name of the metric we collect the data for (in this case used and free).
Now the huge benefit by using this solution is that Icinga for Windows will do the actual construction of this label name, while the developer only has to specify the -MetricIndex and -MetricName for the new New-IcingaCheck function. Even though this is a small, additional rework required for all plugins, the data in general is already available as the previous labels already provided the most important data and can simply modified afterwards.
Visualize Your Metrics
Now this breaking change will sadly break all current visualization views in Grafana, as both the old and new Performance Metric handling cannot be used alongside each other. However, we have good news for everyone!
We as Icinga will provide basic views and dashboards for Grafana which will ship together with Icinga for Windows v1.10.0! If you never had the time to properly visualize your metrics before, you can now make simple use of your InfluxDB 2 and Grafana infrastructure and import our dashboards. Those who already spent a lot of time to create own dashboards, can use our provided config as templates to update their own views.
Lets have a look on a first preview!
-
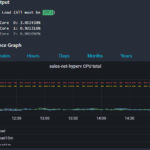
- CPU Total Metric in Icinga Web 2
-
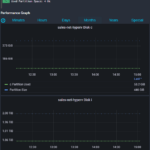
- Disk Metrics in Icinga Web 2
-
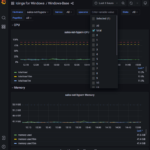
- Grafana Dashboard Overview for Icinga for Windows
We hope you will enjoy the new handling and make plenty of use of our newly created views! We look forward to August to finally hand over this to your customers and community!