This is a guest blogpost from Linuxfabrik
At Linuxfabrik we have been developing a collection of currently 130+ plugins for Icinga, Nagios and other compatible monitoring systems for more than two years now. Each of these plugins is a specialized command line tool written in Python.
Our plugins were created out of our own necessity: Icinga is a great monitoring server, but is shipped without plugins. So, like all other SysAdmins, we had to collect check plugins from various sources. Running in different data centers around the world, the varying quality of the 3rd party plugins and their documentation quickly became apparent. Many of those plugins were annoying with exaggerated alerts. The philosophy behind each plugin and the programming languages used were too different. Many plugins required countless (Perl) dependencies or exotic runtimes, which is a no go on many server systems. And of course, just the one plugin we needed was missing, others were hopelessly outdated, too modest in functionality, tailored only to the developer’s specific use case, or simply unusable in an enterprise environment.
A well engineered, regularly updated and maintained collection of plugins. Specially focused on Linux servers/VMs and used at large scale by the company developing it.
— straessler
Time for our own plugins.
About the Collection
During development we put emphasis on the following points:
- Each plugin is documented in a detailed, standardized README.
- The plugins work fast and save resources.
- The results are always presented consistently. For example, the plugins report “used” instead of “free” for CPU, disk, or application checks, whether on Linux or Windows.
- Outputs to the SysAdmin are human-readable and unambiguous (“GiB”).
- The checks use multi-lines: important information is presented to the SysAdmin in the first line, additional information is returned in a structured way below.
- Each plugin tries to detect as much status and performance data as possible without requiring parameters (Auto Detection/Auto Discovery).
- The default thresholds are taken from practical experience. They are meant to guarantee that alerts are only triggered when the attention of an admin is really required.
- If an alarm is triggered, detailed messages are given and help is given where possible.
- CRITs should only be returned if you have to get up at 2am.
- Plugins can store data in their own SQLite databases. This allows, for example, the “cpu-usage“ check to match the thresholds against the average of the last 5 calls. This prevents alerts if there is only a short spike.
- Code reuse: The plugins leverage our Python libraries, which are also used in other projects, to minimize coding effort and increase quality.
- Dependencies to 3rd party libraries are carefully chosen.
- Most of the time an Icinga Director configuration file and a Grafana panel definition are also provided.
With this collection, the admin gets the most important checks from one source instead of having to laboriously gather them. This guarantees a consistent behavior in case of warnings and criticals.
Why Python?
Initially, we had started developing our own plugins in Bash, but then very quickly switched to Python. Python is preinstalled on many Linux systems, popular and – although it is interpreted – fast and resource-efficient in execution. Plus, programming in Python is just plain fun. Additionally: The plugins can be compiled for Windows using Nuitka.
The Plugins in Detail
An excerpt about what can be monitored:
- All Operating Systems: CPU Usage, Disk I/O, Disk Usage, DNS, Logfiles, Memory Usage, Ping, Procs, Swap Usage, Updates, Uptime, Users
- Linux only: About me, Filesystem inodes and XFS statistics, Kernel Messages, Load, Mail-Queue, Network, NTP, SELinux, Systemd
- Windows only: DHCP-Server Scope-Usage, Scheduled Tasks, Services
- Application server: Apache httpd, Fail2ban, HAProxy, Jitsi, Keycloak, Matomo, Metabase, Nextcloud, Nginx, NodeBB, OnlyOffice, Rocket.Chat, Veeam, WildFly, WordPress
- Databases: MySQL/MariaDB
- Runtimes: PHP, PHP-FPM
- Network and SNMP: Low-level SNMP, LibreNMS (SNMP), OpenVPN
- Containers: Docker and Podman
- Appliances: FortiOS, Huawei Dorado Storage, Kemp, QNAP QTS, Starface PBX
- Hardware and Virtualization: Disk SMART, IPMI, KVM, Redfish, Sensors
New plugins are added with almost every release. Old, no longer working or obsolete plugins are removed.
Some highlights of the plugins:
about-meprovides an accurate overview of the system.- All
cpu-usagechecks warn only if the CPU load is consistently high. dhcp-scope-usageuses WinRM or PowerShell if desired.disk-ioautomatically adjusts its thresholds to detected disk throughputs.disk-smartis based onGSmartControl.feedcan query the Icinga API and stops issuing a warning for a new feed item when it is acknowledged.mysql-statsis based onMySQLTuner.php-statusoptionally relies on amonitoring.phpfile that can provide more PHP insights in the web server context.userscombines different implementation techniques for Linux and Windows.wildflyworks without ajolokia.warplugin by using the native WildFly API.
Check Plugin Poster
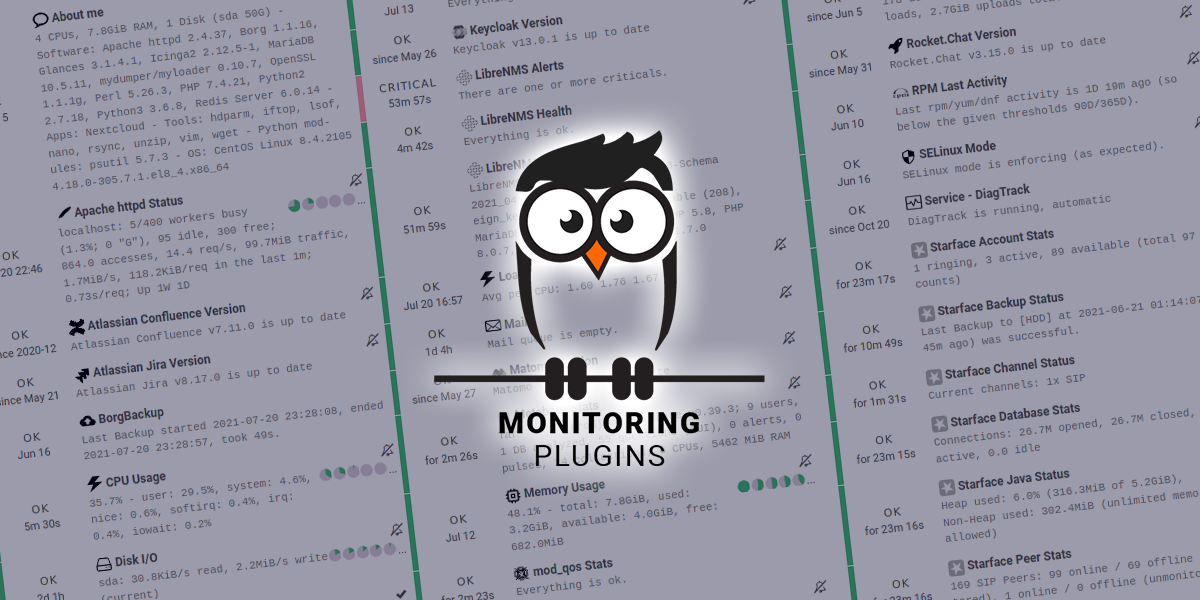
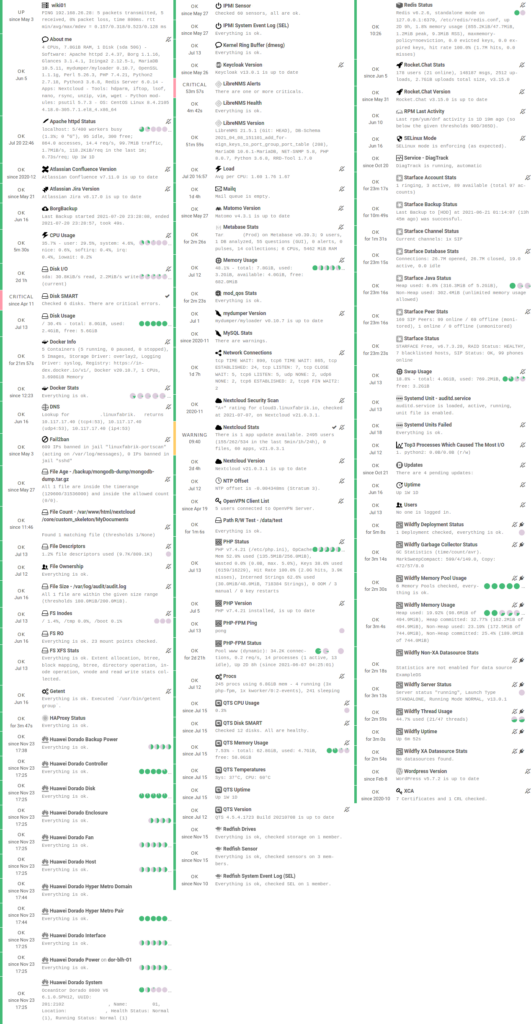
Some of the Linuxfabrik Monitoring Plugins at work on an Icinga server:
Releases
We do not use semantic versioning because the monitoring plugins consist of many different components that are independent of each other. It is difficult to justify that adding a function in one plugin should result in any kind of version jump for the entire collection. Instead, we define point-in-time releases: an incremental version number (YYYYMMDDnn) known from the DNS zone files is used at release time. It is important to note that the version of the Python libraries and the monitoring plugins must be the same.
Some highlights of past releases:
- 2022030201: “Move to GitHub” Release. Plugins compiled for Windows have been moved to https://download.linuxfabrik.ch.
- 2022022801: Focuses on Python 3 and is mainly a bugfix release. 130 Plugins (100 for Windows).
- 2021101401: All checks are now also available in a Python 3 variant. 120 Plugins (80 for Windows).
- 2021061501: 50% of the checks are ported to Python 3. Human-readable units of measurement in the output of the checks are more precise. All README’s have been standardized.
Move to GitHub
As you may already know, our software developments are all open source, but were previously hosted on our self-hosted GitLab server. While the idea of running our own GitLab server was initially appealing, it also has serious drawbacks in terms of FOSS. The community on our GitLab server is too small, as the inhibition to create an account there is too high – even with GitHub account integration. So for many it was not convenient to contribute to our projects. On top of that, Google values GitHub entries much higher, even if the GitHub repos are forked versions of the original repos from our GitLab server.
Therefore, we have moved the monitoring plugins project including source code, issues and releases to GitHub, where everyone can contribute.
Poll
In order to keep improving the monitoring plugins and better answer your needs, we would like to ask for your feedback. Your opinion matters, so please share it with us. Also feel free to tell us your opinion about the project or make any suggestions in the comments section.
To the poll: What software or type of technology should we monitor next?
Community
Hello, I stumbled across your collection and am thrilled! Especially the extensive documentary and the Director Baskets are a dream.
— Stefan Beining
Those who wish to support the development financially have several options:
- Support us via the GitHub Sponsors program with an one-time or monthly payment amounts. GitHub Sponsors is currently still in beta and does not charge any fees – after that, 90% of the amount still reaches us.
- Support us via PayPal.
Links
About Linuxfabrik
We are a Swiss company founded in 2016 in the heart of Zurich. Our employees are highly specialized and help companies and organizations to implement and maintain Linux and Open Source based projects. We support companies from consulting to the secure operation of selected open source software. With our service and support models, we are the extended arm of your IT department: we help in all matters related to Linux and open source, even 7×24 if required. Our experience is based on years of working in the automotive industry, telecommunications and medical informatics.


