Web servers are software services that store resources for a website and then makes them available over the World Wide Web. These stored resources can be text, images, video and application data. Computers that are interfaced with the server mostly web browsers (clients), request these resources and presents to the user. This basic interaction determines every connection between your computer and the websites you visit. Such communication between the web server and the client is always established via the Hypertext Transfer Protocol (HTTP).
Why do I need to monitor a web server?
Like any other softwares, web servers also consumes a number of resources on the running server. In order to be able to process all incoming web requests efficiently and without major delays. For caching some commonly requested content of a website, known as web acceleration. Especially in very large companies with very popular websites, this can be quite demanding. Due to this circumstance, you should always keep an eye on your web server to be able to react even sooner in case of failures or lack of capacity, etc.
To accomplish this, we just need to add our web server as a Host object with some Service objects assigned to it in Icinga2. When you already have the monitoring-plugins installed, you don’t even need to define any CheckCommands as they are already included in the pretty powerful Icinga Template Library (ITL) of Icinga2. If you don’t have any knowledge about what Host, Service objects or CheckCommands are, you can read about them in detail here.
Well, what do I have to monitor exactly?
We obviously aren’t going to cover all the needed steps here and define all the services. But once you’ve seen how easy it is, I’m convinced you can manage the legal ones on your own. These are the most common tasks of a web server which need to be kept track of all the time.
- Requests per sec/min currently being processed by the web server.
- Host resources usage such as CPU, RAM, disk access
- Traffic being transferred to and from the server at any given time via tcp or http
- Availability and load of the web server itself using various of plugins such as icmp, load, ping etc.
- Web Server uptime and much more…
As mentioned before, we need to define our web server as Host object and use the hostalive CheckCommand to have an overview whether the server is running in general and if it can be pinged.
object Host "web-server" {
    /* Import the default host template defined in `templates.conf`. */
    import "generic-host"

    /* Specify the address attributes for checks e.g. `http`. */
    address = "The IP address of the server, the web server is running on. If it is local, simply enter 127.0.0.1"
    address6 = "::1"

    /* Define http vhost attributes for service apply rules in */
    vars.http_vhosts["http"] = {
    	http_uri = "icinga.com"
    }

     /* Define disks and attributes for service apply rules */
     vars.disks["disk nginx"] = {
         disk_partitions = "/var/www"
     }
}
How can I assign services to my web server?
After we have successfully added the host object, we can now assign the required services to it via an Apply Rule. A couple of these services might then look like the following. The first one checks the web server load average.
apply Service "web-server-load" {
    import "generic-service"

    check_command = "load"

    assign where host.name == "web-server"
}
And this apply rule goes through all the disks configured in the host object above and creates a proper service object for our web server. Well, I have here e.g. /var/www as disk partition specified, but might be different on your servers. The TimePeriods are also intended as an example, if you don’t have a TimePeriod already preconfigured, you can remove the if statements completely and just return a value.
apply Service "Check " for (disk => config in host.vars.disk) {
    import "generic-service"

    check_command = "disk"

    vars.disk_units = "GB"
    vars.disk_wfree = {{
        if (get_time_period("holidays").is_inside) {
            return "3%"
        } else {
            return "15%"
        }
    }}

    vars.disk_cfree = {{
        if (get_time_period("holidays").is_inside) {
            return "1%"
        } else {
            return "5%"
        }
    }}

    vars += config
}
In addition, our subsequent apply rules examples iterates through all configured vhosts and creates an http check.
apply Service "host-" for (http_vhost => config in host.vars.http_vhosts) {
  import "generic-service"

  check_command = "http"

  vars += config
}
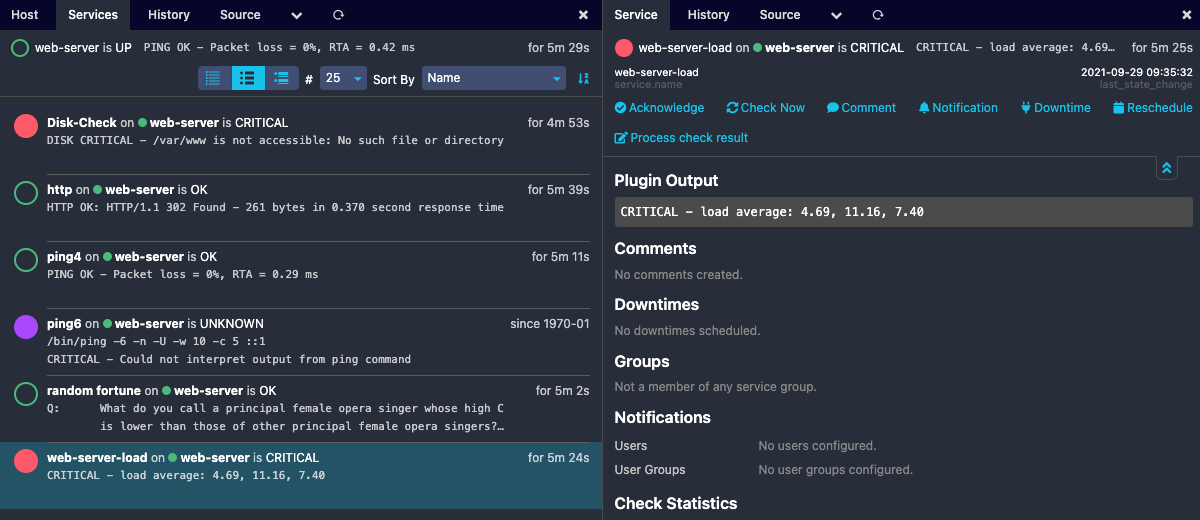
So, based on these examples, you can now add the rest on your own. Should you get stuck or if something is not clear, don’t hesitate to ask here or in our community form. For now, let’s see how it all looks in Icinga Web 2. However, you have to restart Icinga2 first, so that the new changes are applied. As you can see, with very simple steps you can keep track of everything so as not to neglect the user experience on your website.
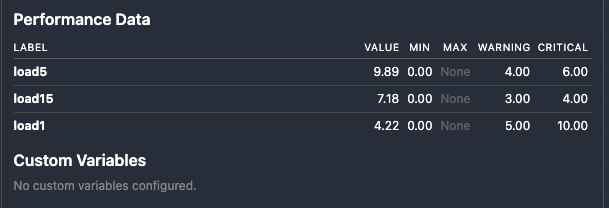
And the performance data from the load check might look like as follows. You can also display this as a graph with Grafana or Graphite, however, this is a completely different site.