In this blogpost, I explain how to create dashlets using custom filters. This way you can create dashlets of your own which you find is necessary. Having dashboards in fact improves monitoring. Dashlets are the different sections under the given dashboard, which are the snapshots of some monitoring views and are defined by a name.
Requirements: Icinga 2 and Icinga Web 2 installed. Please refer to my previous blogpost (Rule based monitoring with Icinga apply rules) to create hosts and services as they will be used in this blog post as well.
Here, I will create a new dashboard and three new dashlets for services based on service groups to demonstrate how we can use custom filters to create Dashboards.
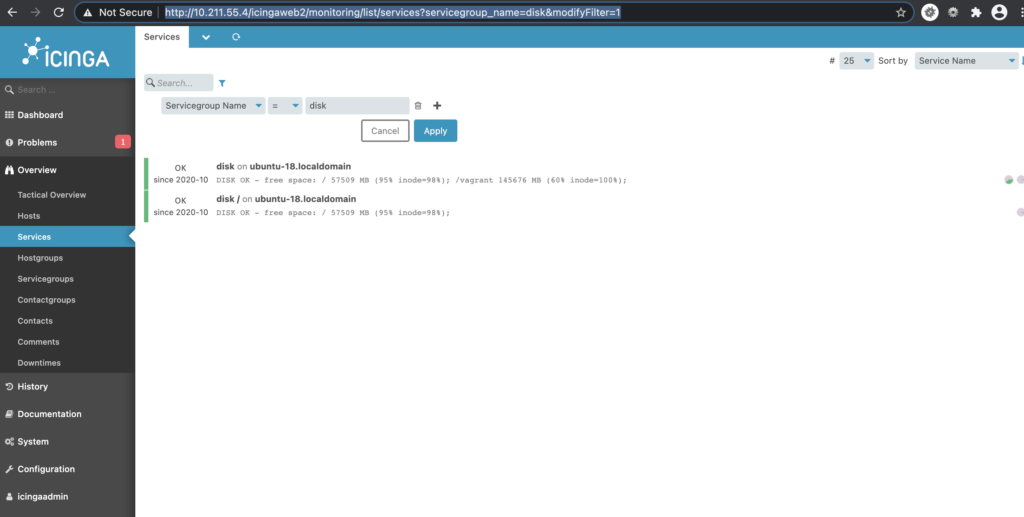
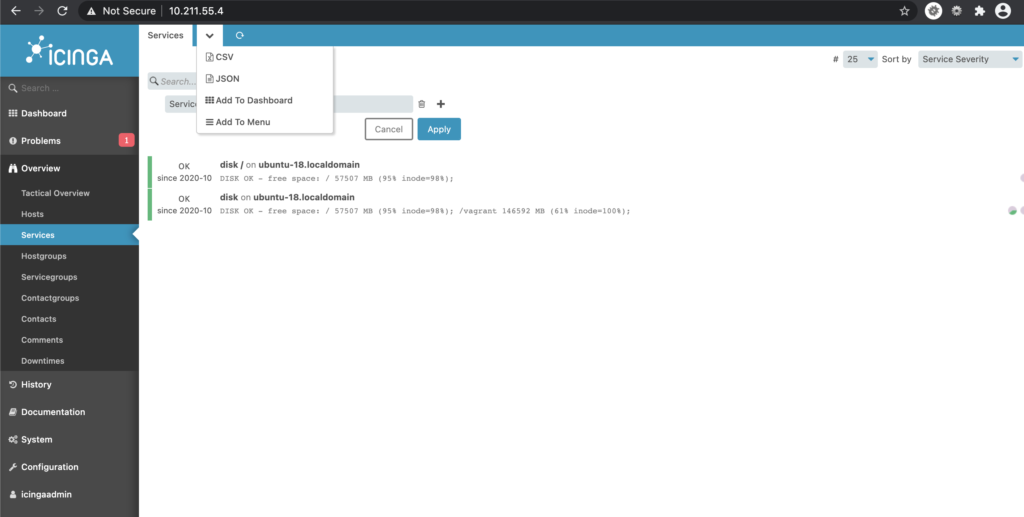
- After logging into Icinga Web 2, go to Overview->Services.
- Apply filter Servicegroup Name = disk.
- Copy the resulting URL.
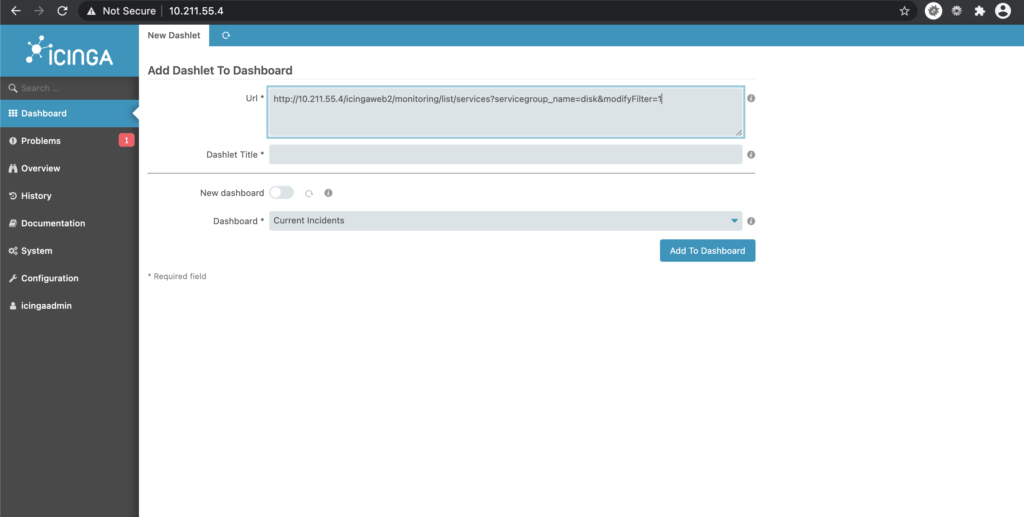
Now go to Dashboard->dropdown menu->Add Dashlet.
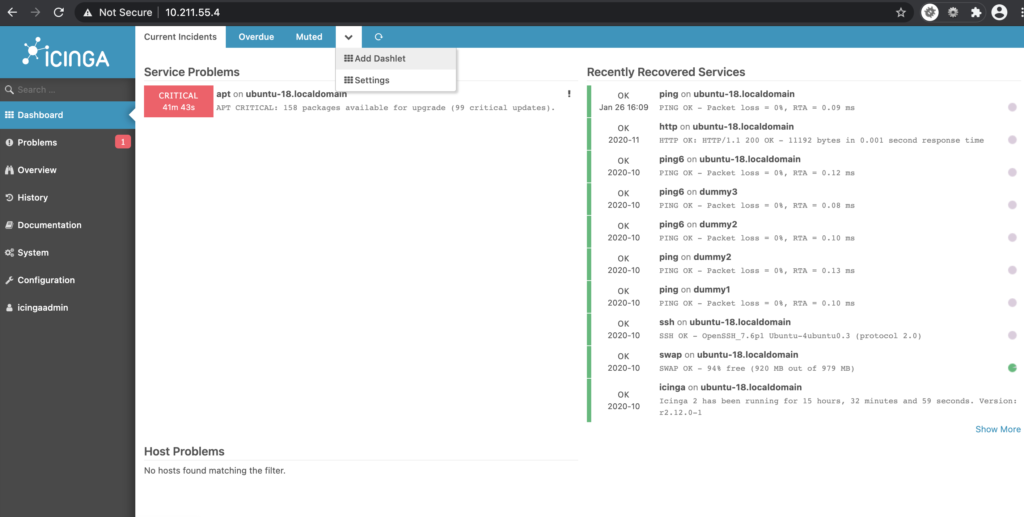
Paste the copied URL in the Url field.
Or next to title of the page there is as a dropdown menu. Go to this dropdown menu->Add to Dashboard.
This will directly redirect you to New Dashlet page, with Url field preloaded.
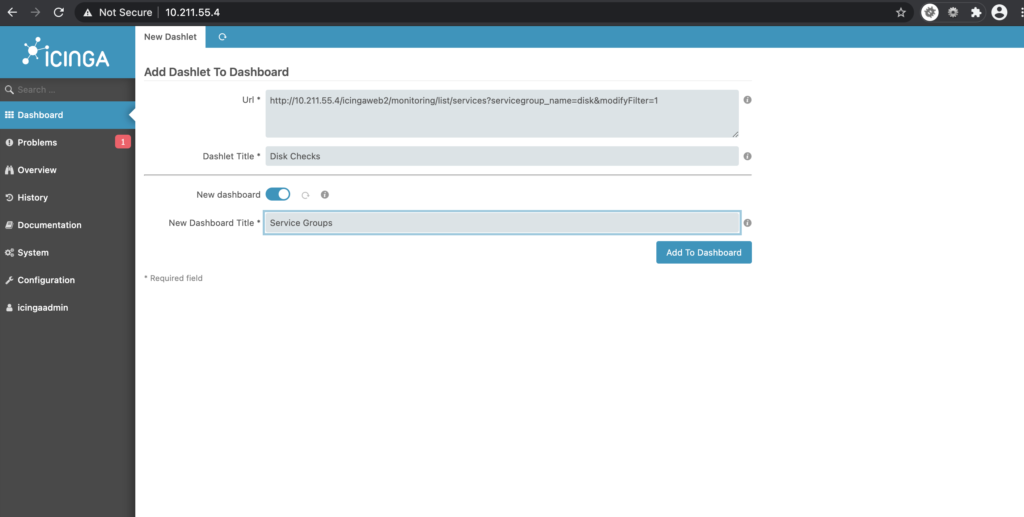
- Define Dashlet Title as “Disk Checks”.
- Enable New dashboard option.
- Give a dashboard name in Dashboard field as “Service Groups” as it is a new dashboard (if you are adding a dashlet to existing dashboard select the dashboard from the dropdown to which you are adding the dashlet to).
- Click Add To Dashboard.
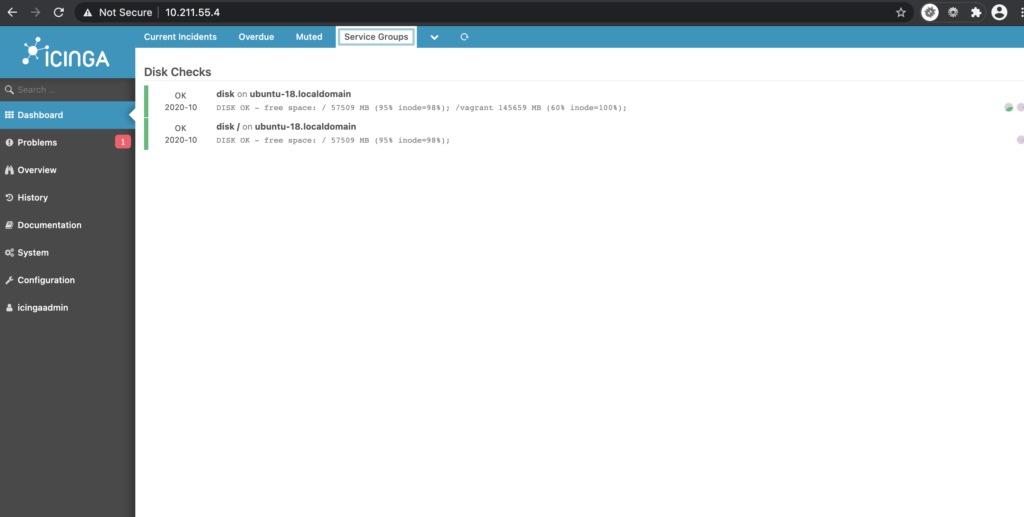
Go to Dashboard->Service Groups, you will see the newly added dashlet Disk Checks.
Let us now add dashlets, Ping Checks (filter, Servicegroup Name = disk) and HTTP Checks (filter, Servicegroup Name = http). So first you need to:
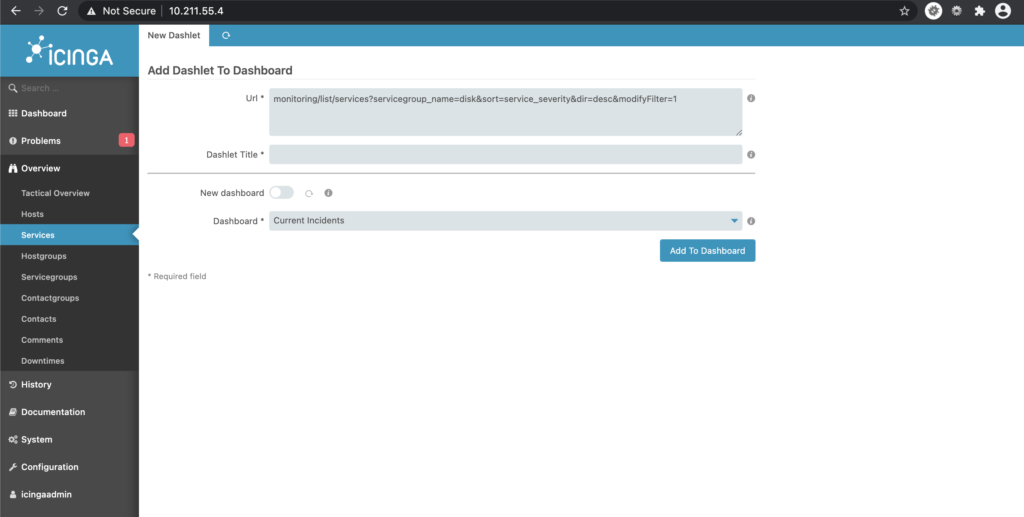
- Filter the services (Overview->Services), and copy the URL.
- Go to Dashboard->dropdown menu->Add Dashlet paste the URL in Url field.
- Give the Dashlet Title.
- Here, we will not enable New dashboard option.
- We will select “Service Groups” dashboard name from Dashboard dropdown list.
- Add the dashlets (click Add To Dashboard).


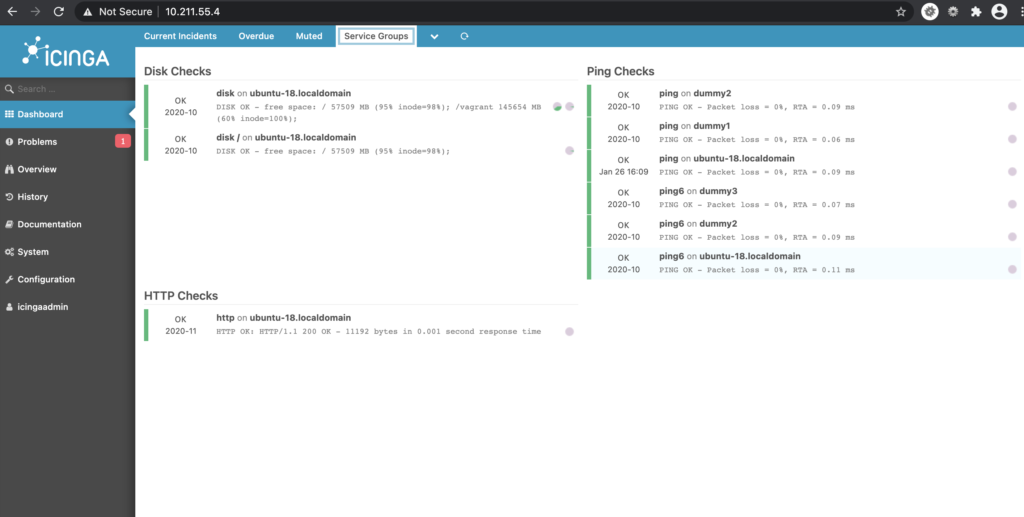
Now, go to Dashboards->Service Groups, you will see all three dashlets.
So, this is how you create dashboards using custom filters. You can use more complicated filters if it is necessary.
If you go to Dashboard->dropdown menu->Settings, you will see the configured filters for each dashboards.
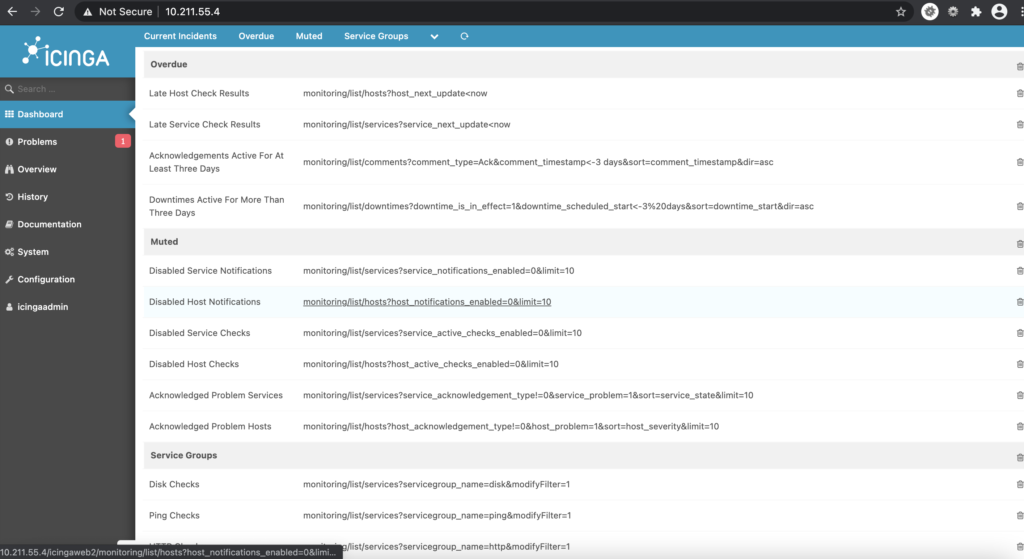
Some preconfigured filters are also shown in the above screenshot. This gives an idea about some complicated filters you can use.