In this post we will take a look at the icingadb check command built into Icinga 2 for monitoring the health of Icinga DB. If you have already configured it, this blog post will give you some insights on what it actually checks, otherwise, it showcases what useful health checks you are missing out on and should serve as a motivation to enable the check.
Enabling the check is actually pretty easy: you only need to create a service on each of you master nodes using the icingadb check command. There is a small number of options, though these are just for fine-tuning, the check is expected to work fine without setting any of them. This makes the check look inconspicuous at first glance, but there is quite a lot happening under the hood. Most information flows from Icinga 2 to Icinga DB, but the Icinga DB daemon also writes some health information back to Redis that can be checked by Icinga 2. Once the check command is configured, these checks are performed automatically:

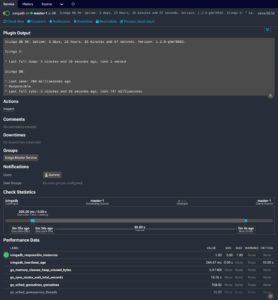
Icinga DB health check service shown in Icinga Web
- Connectivity: Icinga 2, Redis, Icinga DB and the SQL database must all be running and connected to each other.
- High-Availability status: If more than one Icinga DB process is writing to the same database, they coordinate with each other. It is checked whether this is currently working as expected.
- Heartbeat delays: Icinga 2 and Icinga DB regularly exchange heartbeat messages which should be received and processed without much delay.
- Clock Drift: In case the components (Icinga 2, Icinga DB, Redis) are installed on different machines, their system clocks could be out of sync. The implementation requires that the clocks are reasonably in sync, hence the variation is measured and also checked.
- Backlog: Neither should Icinga 2 accumulate pending Redis queries, nor should Icinga DB be too slow to process the state/config updates and history entries from Redis and write them to the database. This part of the check is intended to be a better replacement for the
ido_pending_queries_warning(and critical) option of the oldidocheck command: finding a good threshold for the absolute number of queries is hard as it changes with the size of the infrastructure and load of the monitoring, hence there was no default previously. Instead, theicingadbcheck issues a warning if there are queries that have been waiting for more than 5 minutes (by default) to be executed. - Initial sync duration: After starting, both Icinga 2 and Icinga DB check what parts of the config are up-to-date and what needs updating. This should not take too long of course.
The check provides quite a number of performance data values, looking at them in Icinga Web might be overwhelming. Most of these values fall into one of the following categories: Metrics prefixed with icinga2_ relate to the Icinga DB feature within Icinga 2 itself and how it writes data to Redis. In contrast, those prefixed with icingadb_ are related to the Icinga DB daemon process. Finally, there is a large number of of metrics prefixed with go_: The Icinga DB daemon is implemented in the Go programming language and the Go runtime automatically collects a bunch of metrics that are exposed here. More information on the Go metrics can
be found in the corresponding documentation. However, most users should not need to look into the latter, but they are there in case more insights into that process are needed.


