NETGEAR AV Line monitoring
With the new NETGEAR AV Line monitoring plugin, you can easily monitor NETGEAR AV Line devices in Icinga 2. This lightweight yet powerful Go-based tool communicates directly with the devices’ API and provides clear status values – including perfdata.
What the Plugin Does for NETGEAR AV Line Monitoring
This plugin was built specifically for the NETGEAR AV Line. It is not intended for other models, as those might return incorrect results.
It collects and checks several important hardware and network metrics, such as:
- CPU and RAM usage
- Fan speed and temperature sensors
- Port statistics (inbound and outbound traffic)
- PoE data (power consumption and activation status)
These checks provide a quick overview of your device’s health. Therefore, it’s ideal for AV or network infrastructures where stability and temperature control are crucial.
Integration in Icinga
The plugin uses the go-check framework and returns its results in an Icinga-compatible format. Because of that, you can integrate this plugin just like any other Icinga 2 check command.
A simple example:
check_netgear -u admin -p VerySecurePassword --mode basic
Result:
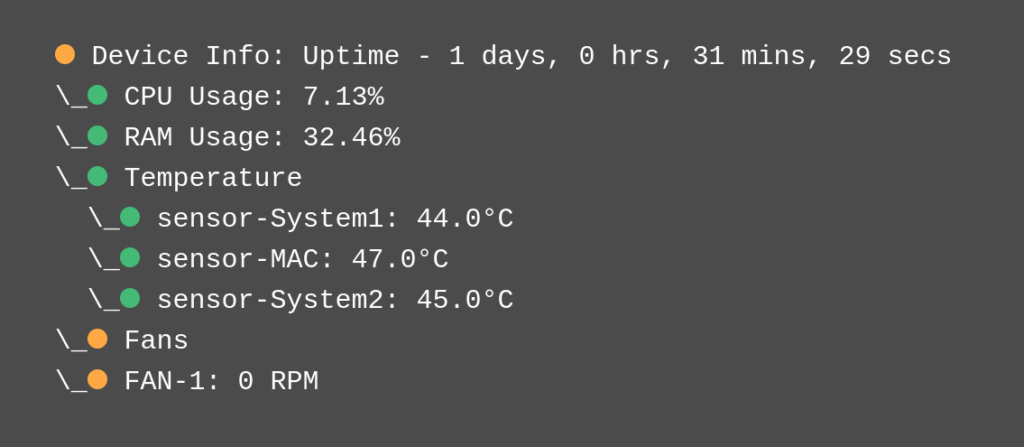
[WARNING] Device Info: Uptime - 1 days, 0 hrs, 31 mins, 29 secs
\_[OK] CPU Usage: 7.13%
\_[OK] RAM Usage: 32.46%
\_[OK] Temperature
\_[OK] sensor-System1: 44.0°C
\_[OK] sensor-MAC: 47.0°C
\_[OK] sensor-System2: 45.0°C
\_[WARNING] Fans
\_[WARNING] FAN-1: 0 RPM
|CPU=7.13;;;0;100 RAM=32.46;;;0;100 sensor-System1=44;;;0 sensor-MAC=47;;;0 sensor-System2=45;;;0 'Fans speed'=0;;;0
Which appears in Icinga Web like this:
Flexible Configuration and Thresholds for NETGEAR AV Line Monitoring
You can control the scope of the checks with several command-line flags. In addition to specifying your hostname, username, and password, you can choose a mode (basic, ports, poe) or exclude certain sensors if you don’t need them.
Furthermore, you can define custom threshold values for every metric. For example, use --cpu-warning and --cpu-critical to set your own CPU usage limits. The same applies to other metrics such as RAM, temp (temperature), and fans (fans speed).
As a result, your monitoring setup stays clean, lightweight, and perfectly adapted to your environment.
Conclusion
This plugin makes it easy to integrate AV Line device monitoring into Icinga – without additional dependencies or complex SNMP setups.
In addition, it’s fully open source and available under the MIT license.
View the repository on GitHub: https://github.com/Icinga/check-netgear
While this is a standalone plugin for NETGEAR devices, you can enhance your monitoring stack further with various Icinga integrations.