Today we will talk about exporting data (such as hosts and services) from Icinga Web 2 into various formats.
Exporting From the UI
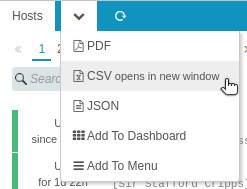
You have probably already seen the drop-down in the upper left corner of a list? If you hover there with your mouse or focus it by keyboard and hit Enter, you can easily export the list.

Export to PDF, CSV or JSON with a single click!
The exported data will also be filtered and sorted if your list is. The only thing that does not apply to exported data are the limit and page options. Keep that in mind when exporting large unfiltered datasets, because these may not be successful unless you increase PHP’s memory limit.
Exporting From the API
It is of course also possible to export data by use of the JSON API of Icinga Web 2. We now take a look at such a request and how to perform it.
$ curl -u icingaadmin:icinga -H "Accept: application/json" localhost/icingaweb2/monitoring/list/hosts?hostgroup_name=app-web | python3 -m json.tool
This sends a HTTP GET request to Icinga Web 2 that is served at /icingaweb2 by a web-server listening on localhost. The request has to be authenticated, so a user and password are sent with -u by using Basic Authentication. The Accept: application/json header line sent with -H is required so that Icinga Web 2 accepts our authentication credentials and provides us with a JSON encoded result. curl’s output is then piped to python in order to show the result in a human friendly layout. This is not required if you process the result by another application.
...
        "host_state": "0",
        "host_acknowledged": "0",
        "host_output": "The earth is like a tiny grain of sand, only much, much heavier.",
        "host_attempt": "1/3",
        "host_in_downtime": "0",
        "host_is_flapping": "0",
        "host_state_type": "1",
        "host_handled": "0",
        "host_last_state_change": "1599477869",
        "host_notifications_enabled": "1",
        "host_active_checks_enabled": "1",
        "host_passive_checks_enabled": "1",
        "host_check_command": "random fortune",
        "host_next_update": "1599633604"
    },
    {
        "host_icon_image": "",
        "host_icon_image_alt": "",
        "host_name": "dummy-279",
        "host_display_name": "dummy-279",
...
Including Additional Data
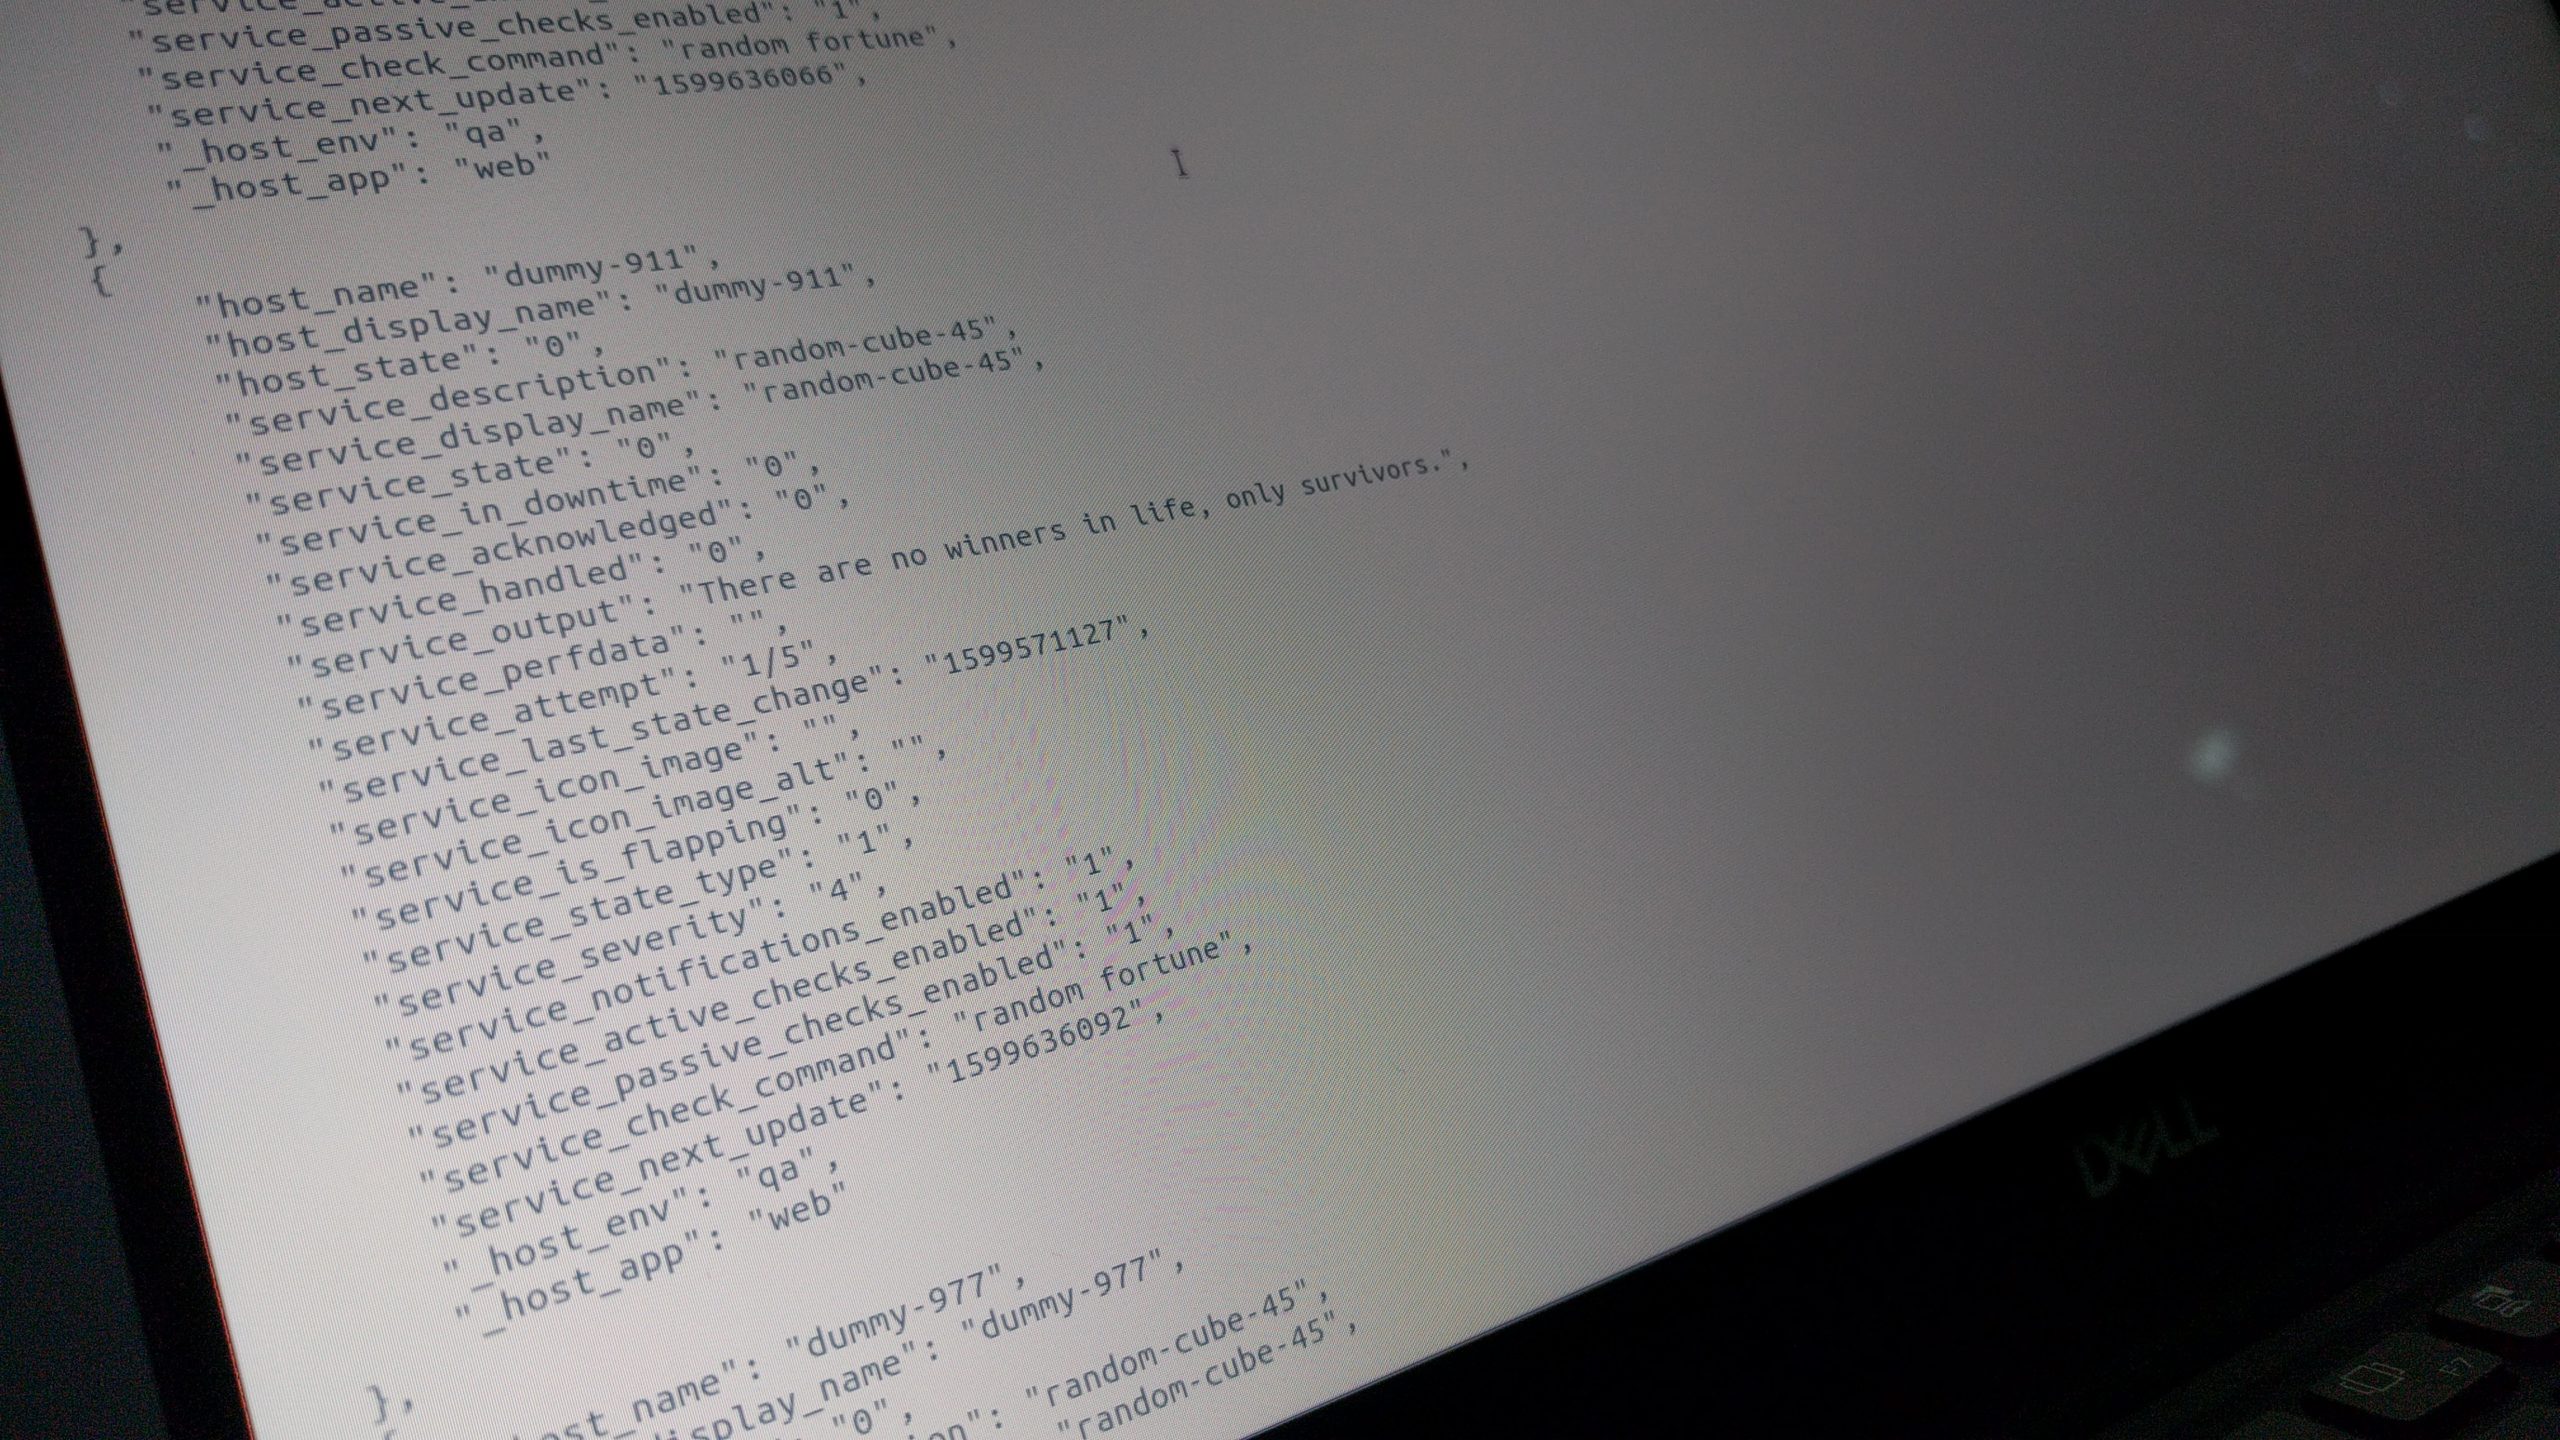
The host and service lists support an extra feature which allows to include additional details in the result. The following request adds the host custom variables env and app to the result.
$ curl -u icingaadmin:icinga -H "Accept: application/json" localhost/icingaweb2/monitoring/list/services?addColumns=_host_env,_host_app | python3 -m json.tool
...
        "host_state": "0",
        "service_description": "random-cube-45",
        "service_display_name": "random-cube-45",
        "service_state": "0",
        "service_in_downtime": "0",
        "service_acknowledged": "0",
        "service_handled": "0",
        "service_output": "Music in the soul can be heard by the universe.",
        "service_perfdata": "",
        "service_attempt": "1/5",
        "service_last_state_change": "1599561250",
        "service_icon_image": "",
        "service_icon_image_alt": "",
        "service_is_flapping": "0",
        "service_state_type": "1",
        "service_severity": "4",
        "service_notifications_enabled": "1",
        "service_active_checks_enabled": "1",
        "service_passive_checks_enabled": "1",
        "service_check_command": "random fortune",
        "service_next_update": "1599634310",
        "_host_env": "acceptance",
        "_host_app": "storage"
    },
    {
        "host_name": "dummy-367",
        "host_display_name": "dummy-367",
...


