During the past years we made plenty of contributions to improve the current state of the Windows monitoring. We tried to improve the actual installation with the Icinga 2 Powershell Module, allowing users to easier automate installation and configuration of Icinga 2. On a long term we however wanted to improve the monitoring of Windows infrastructures entirely, by not only providing new plugins but also to increase the contribution by the community.
Last year a first prototype was developed as a proof of concept on how Windows information could be fetched and is now continued as Icinga PowerShell Framework.
One Framework for everything
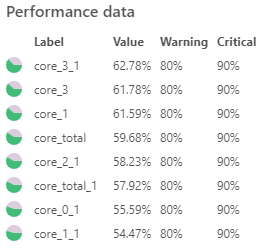
The Framework will provide all core functionality for developing plugins and to ensure standardised output for Icinga. This will include properly formatted performance metric output for your graphs within Graphite and/or Grafana. As a Framework alone of course does not provide monitoring capabilities, we will ship our very own re-designed PowerShell Plugins.
New Windows Plugins
With the new PowerShell Framework a bunch of the Plugins will be shipped separately in an own repository, to ensure updates can be applied more frequently and without having a huge impact on the core components itself. The following Plugins are currently available:
- Invoke-IcingaCheckBiosSerial
- Invoke-IcingaCheckCheckSum
- Invoke-IcingaCheckCPU
- Invoke-IcingaCheckDirectory
- Invoke-IcingaCheckEventlog
- Invoke-IcingaCheckFirewall
- Invoke-IcingaCheckMemory
- Invoke-IcingaCheckPerfcounter
- Invoke-IcingaCheckProcessCount
- Invoke-IcingaCheckService
- Invoke-IcingaCheckUpdates
- Invoke-IcingaCheckUptime
- Invoke-IcingaCheckUsedPartitionSpace
- Invoke-IcingaCheckUsers
More will follow periodicaly over the time. If you wish to contribute your own Plugins to the community, you can have a look on the first draft of the developer guide.
Collecting Metrics over time
Another feature is to run the PowerShell Framework within an own service, which then will execute selected Plugins by you within a given time and collect metrics. By doing so, you can define how they should be combined to get a better idea on how output will perform over time.
Tease Trailer
Next Steps
We have released all repositories as Release Candidates and would love to hear your feedback! Within the next weeks and month we will continue to extend these components and to improve the use experience wherever required.
Stay tuned for updates !


