Icinga 2 Addons 
Graphing 
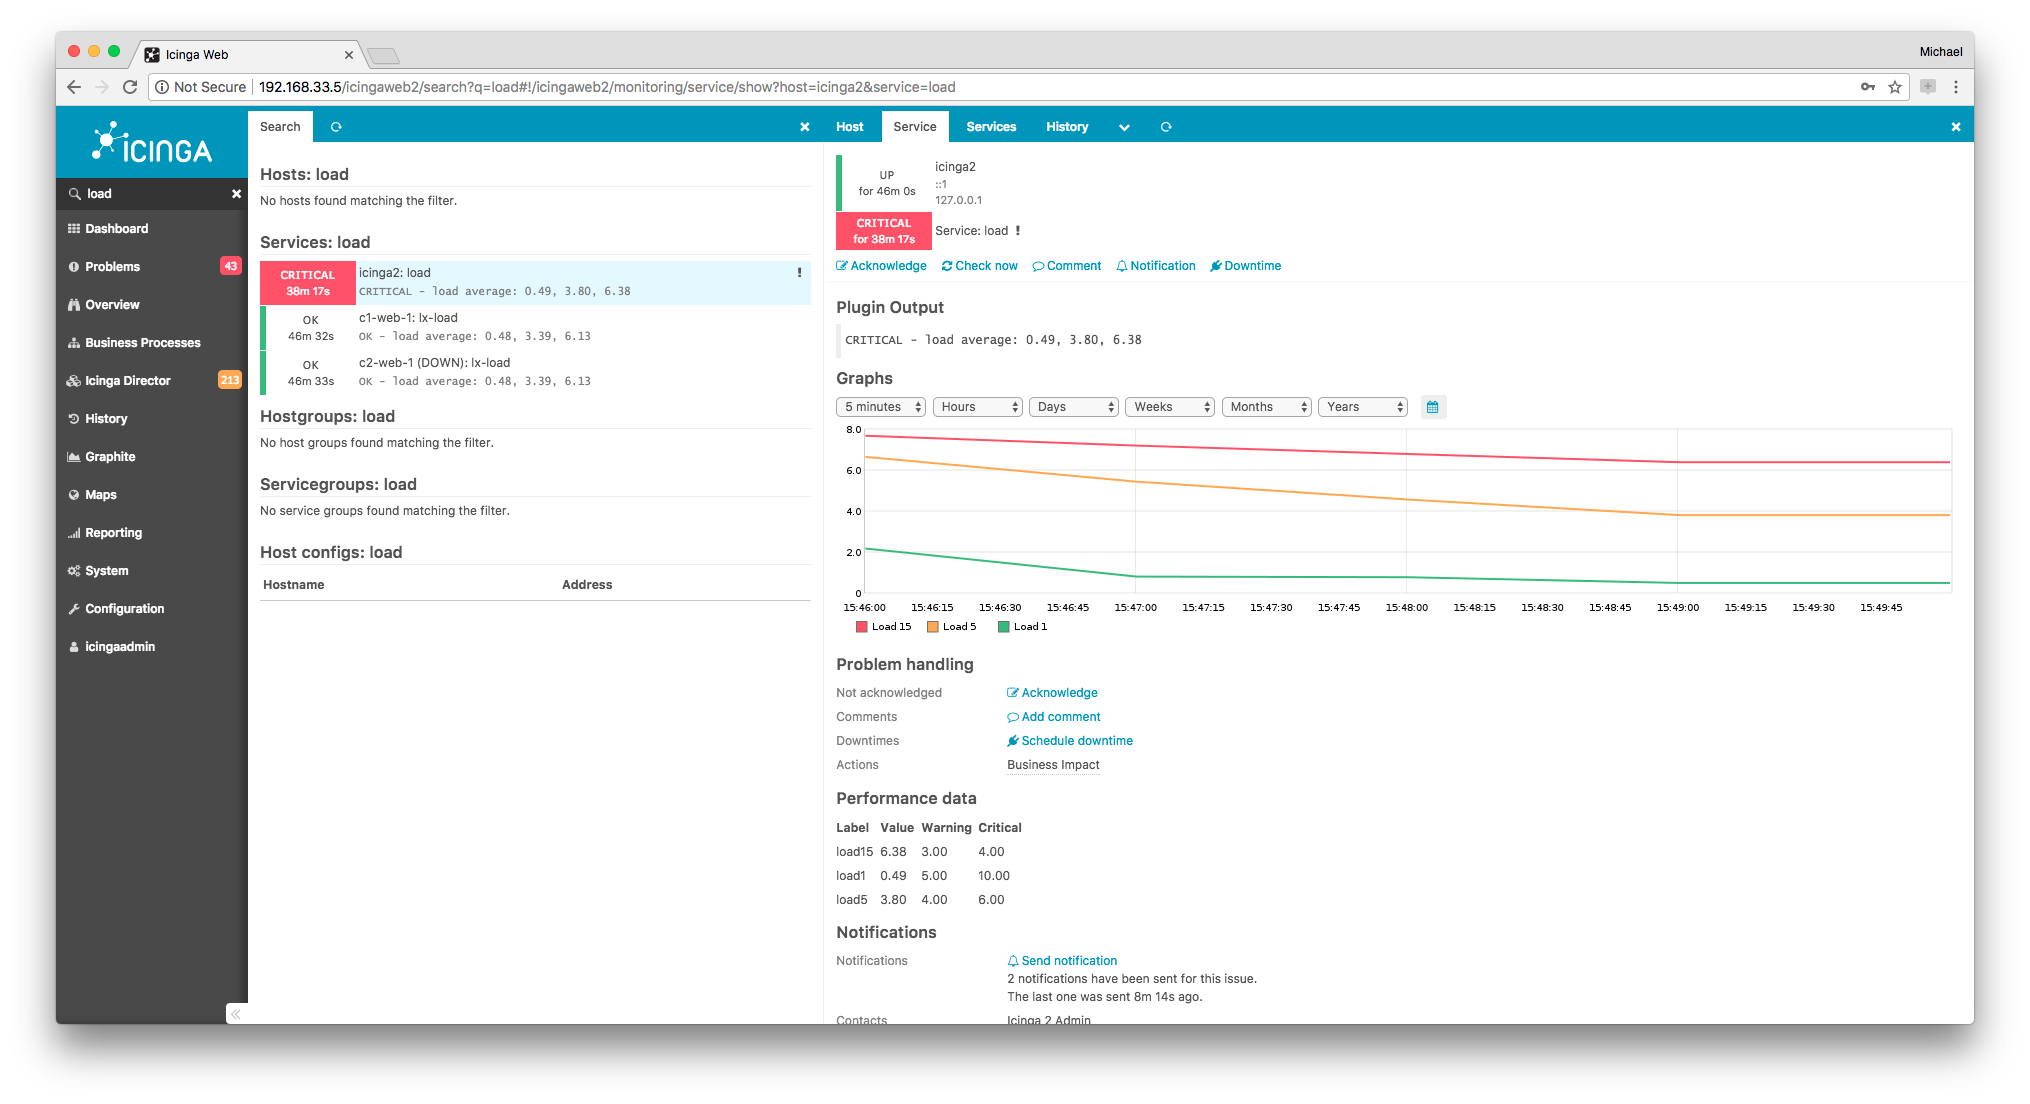
Graphite 
Graphite is a time-series database storing collected metrics and making them available through restful apis and web interfaces.
Graphite consists of 3 software components:
- carbon – a Twisted daemon that listens for time-series data
- whisper – a simple database library for storing time-series data (similar in design to RRD)
- graphite webapp – a Django webapp that renders graphs on-demand using Cairo
You need to install Graphite first, then proceed with configuring it in Icinga 2.
Use the GraphiteWriter feature for sending real-time metrics from Icinga 2 to Graphite.
# icinga2 feature enable graphite
A popular alternative frontend for Graphite is for example Grafana.
Integration in Icinga Web 2 is possible by installing the official graphite module.
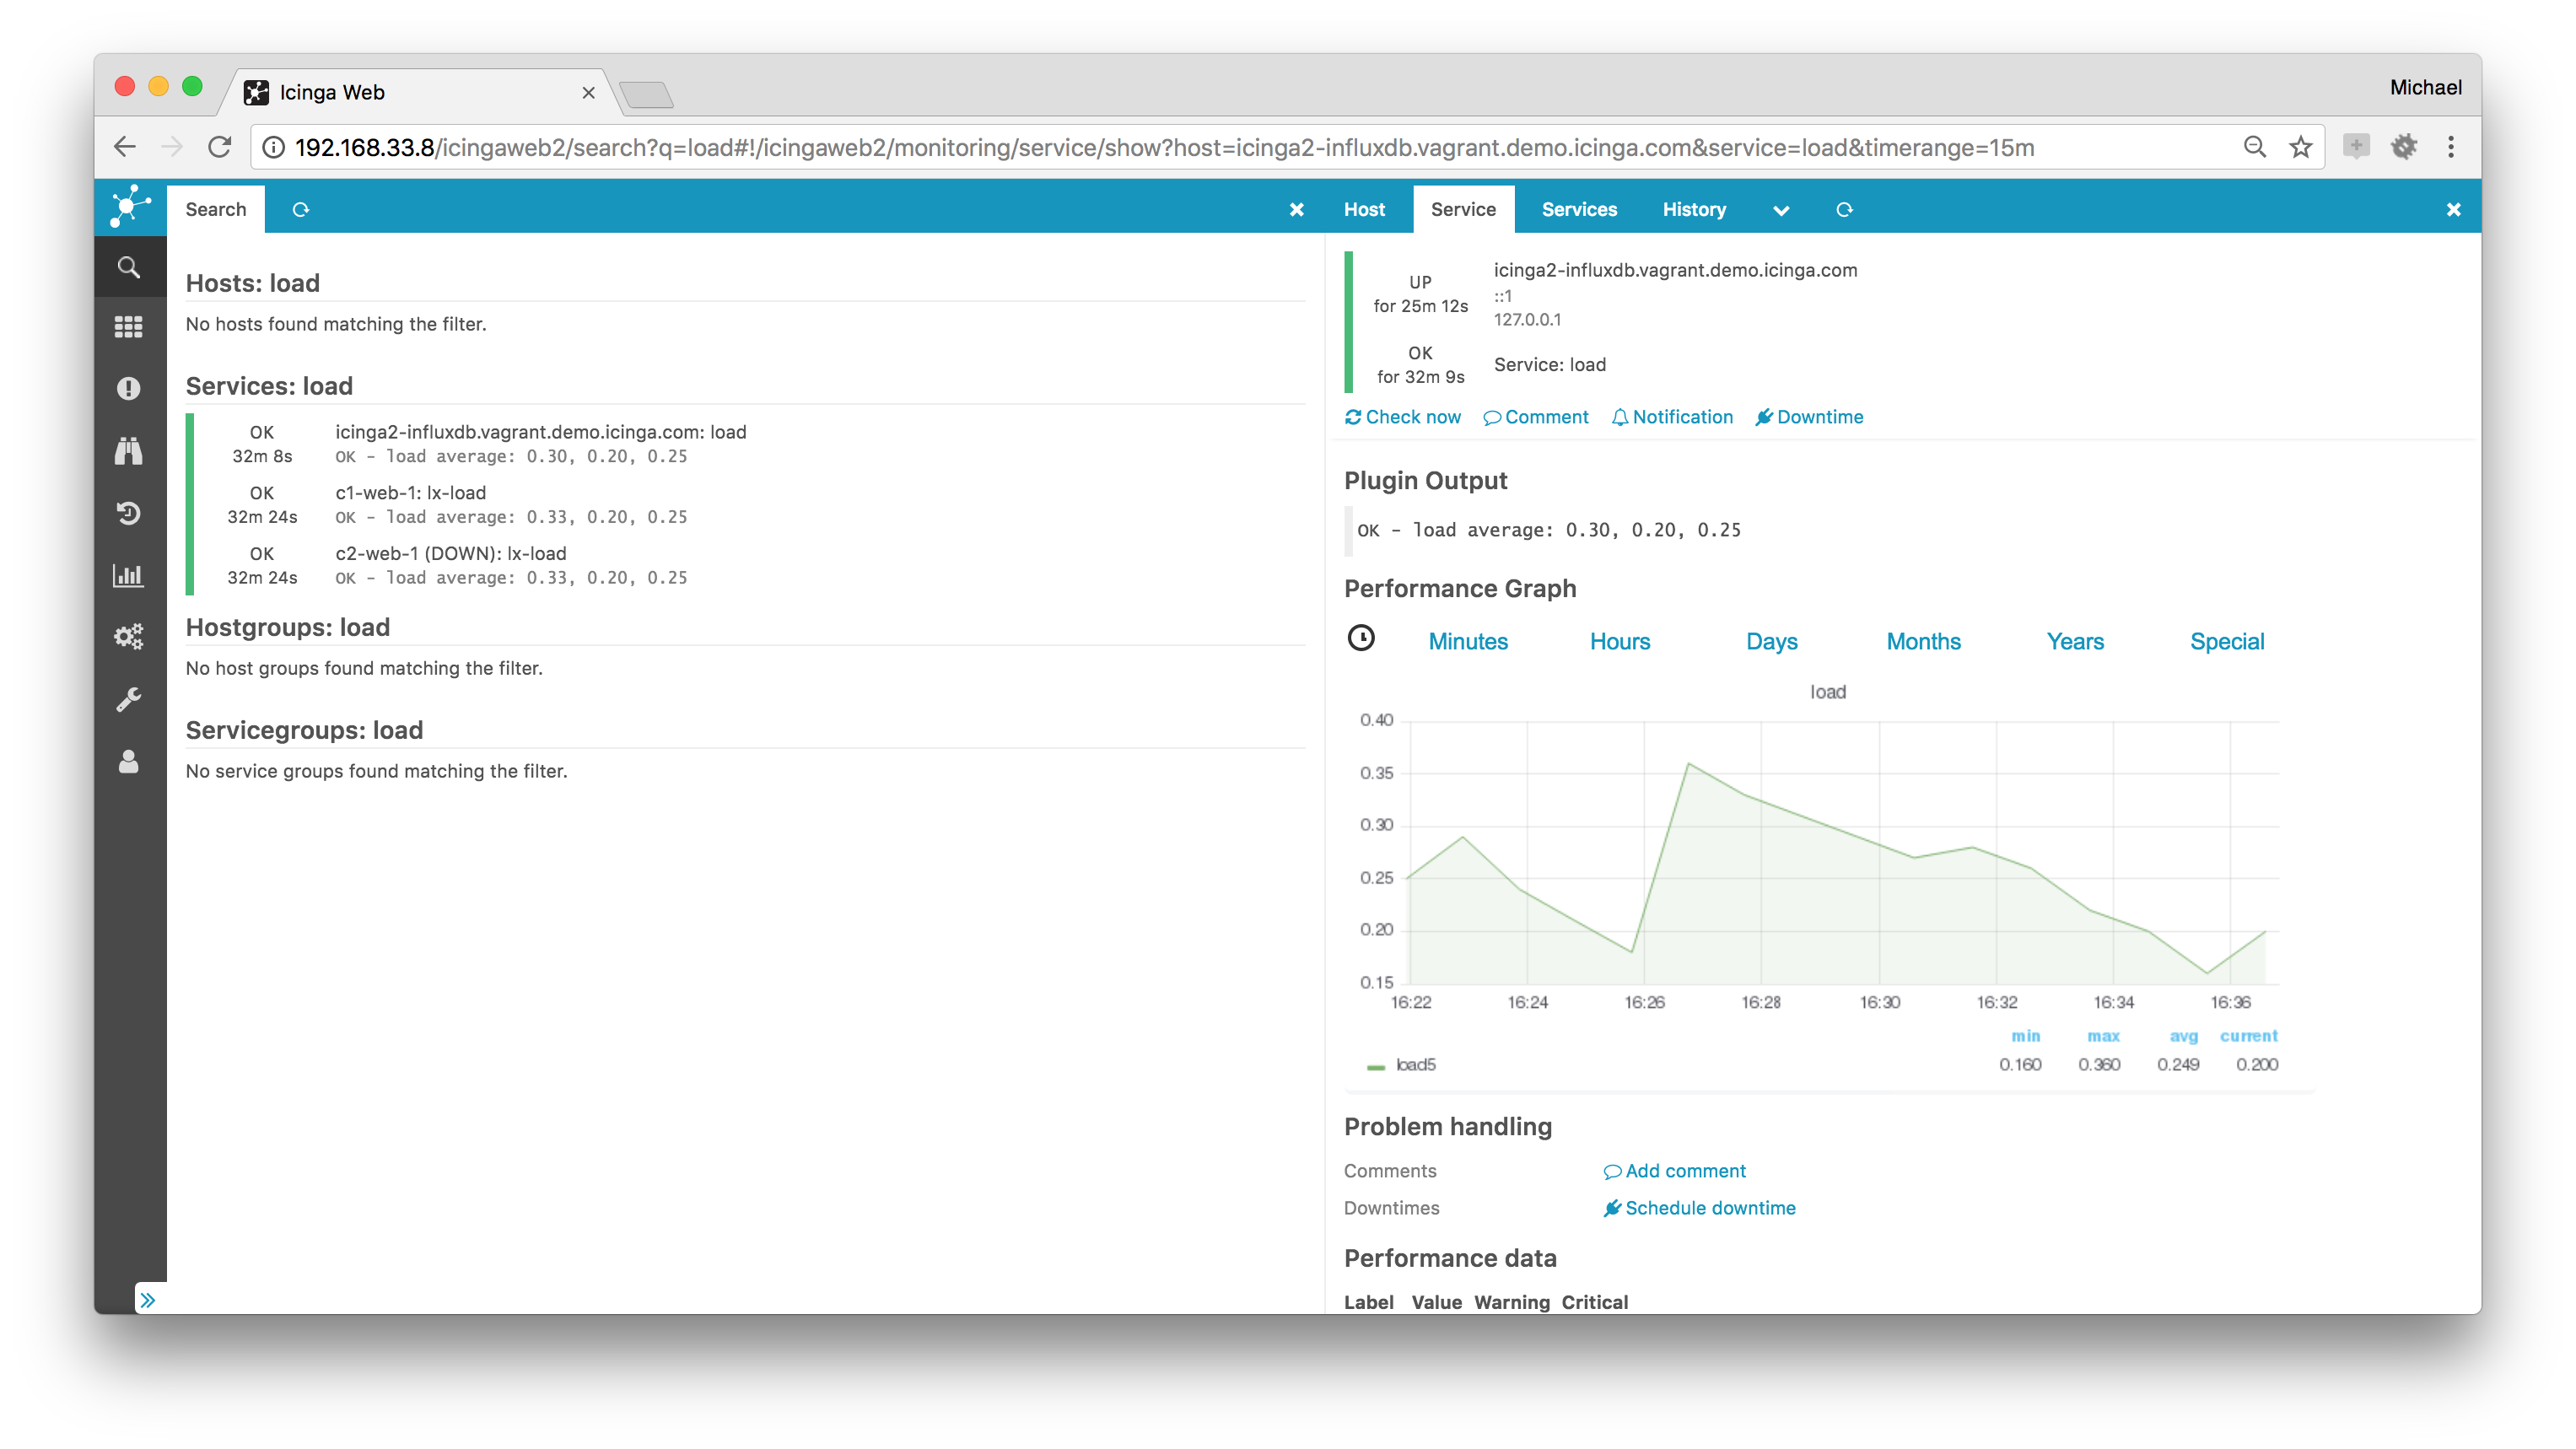
InfluxDB 
InfluxDB is a time series, metrics, and analytics database. It’s written in Go and has no external dependencies.
Use the InfluxdbWriter feature for sending real-time metrics from Icinga 2 to InfluxDB.
# icinga2 feature enable influxdb
A popular frontend for InfluxDB is for example Grafana.
Integration in Icinga Web 2 is possible by installing the community Grafana module.
PNP 
PNP is a graphing addon.
PNP is an addon which adds a graphical representation of the performance data collected by the monitoring plugins. The data is stored as rrd (round robin database) files.
Use your distribution’s package manager to install the pnp4nagios package.
If you’re planning to use it, configure it to use the bulk mode with npcd and npcdmod in combination with Icinga 2’s PerfdataWriter. NPCD collects the performance data files which Icinga 2 generates.
Enable performance data writer in icinga 2
# icinga2 feature enable perfdata
Configure npcd to use the performance data created by Icinga 2:
vim /etc/pnp4nagios/npcd.cfg
Set perfdata_spool_dir = /var/spool/icinga2/perfdata and restart the npcd daemon.
There’s also an Icinga Web 2 module for direct PNP graph integration available at Icinga Exchange.
More information on action_url as attribute and graph template names.
Visualization 
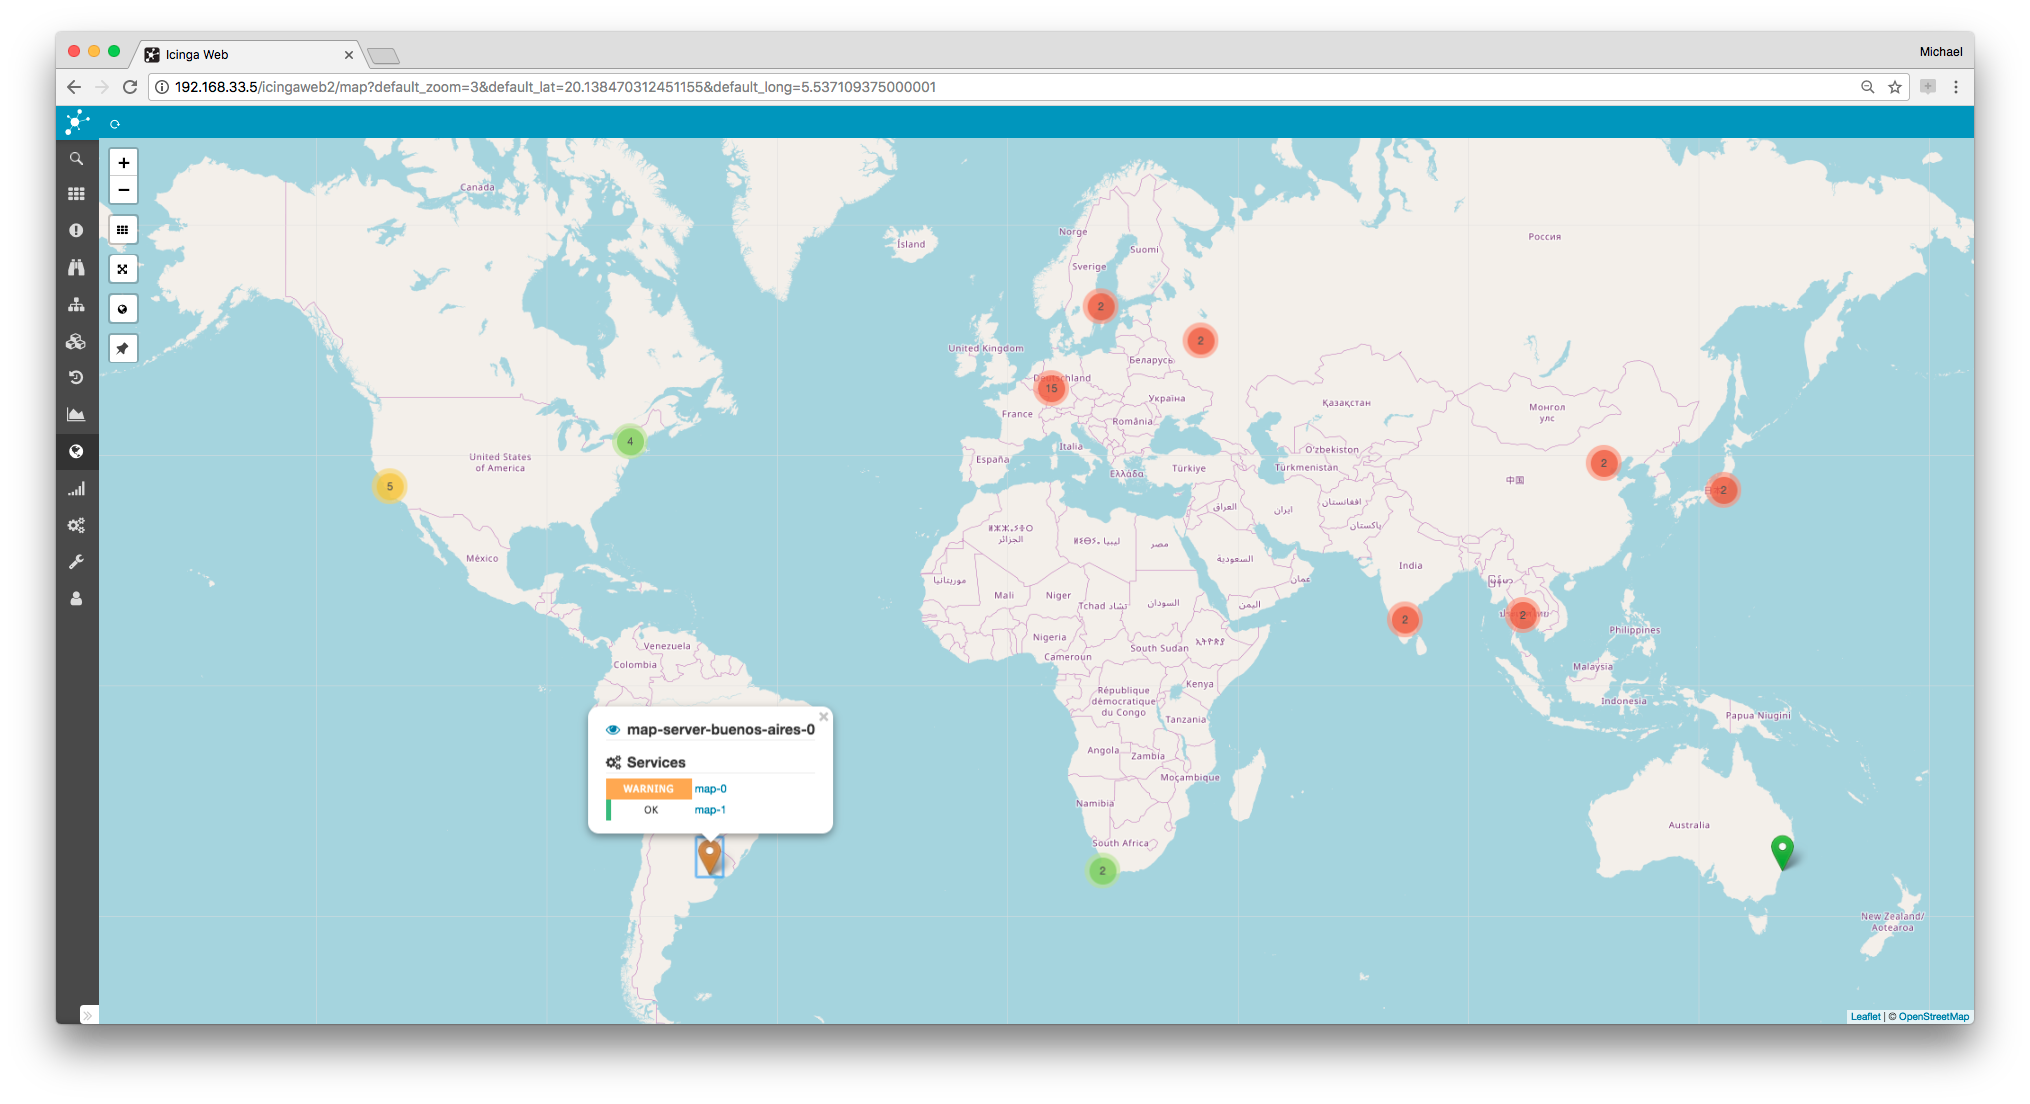
Maps 
This community module displays host objects as markers on openstreetmap in Icinga Web 2. It uses the data provided by the monitoring module and as such the DB IDO from Icinga 2.
If you configure multiple hosts with the same coordinates, i.e. servers in a datacenter, a clustered view is rendered.
Check the Map module docs for more details on installation, configuration and integration.
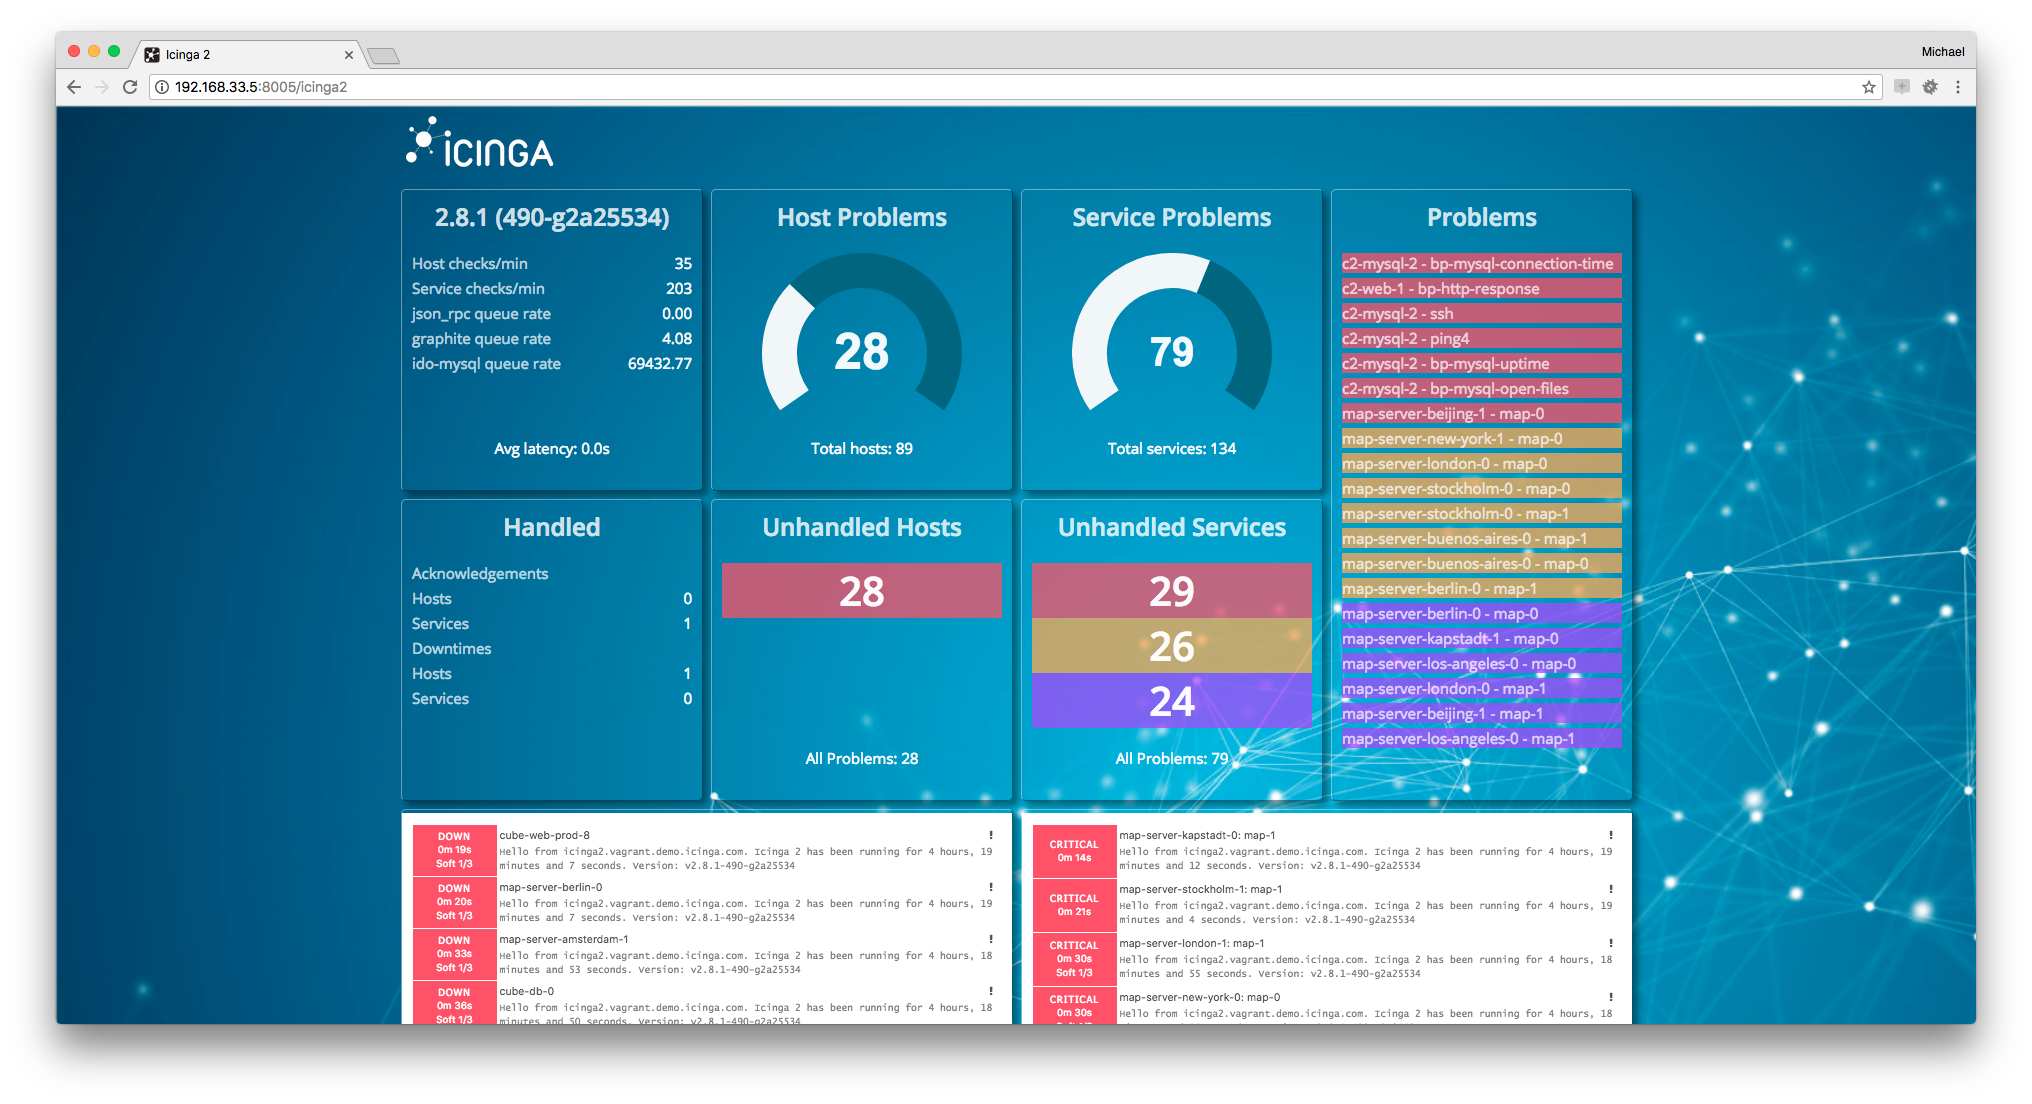
Dashing Dashboard 
The Icinga 2 dashboard is built on top of Dashing and uses the REST API to visualize what’s going on with your monitoring. It combines several popular widgets and provides development instructions for your own implementation.
The dashboard also allows to embed the Icinga Web 2 host and service problem lists as Iframe.
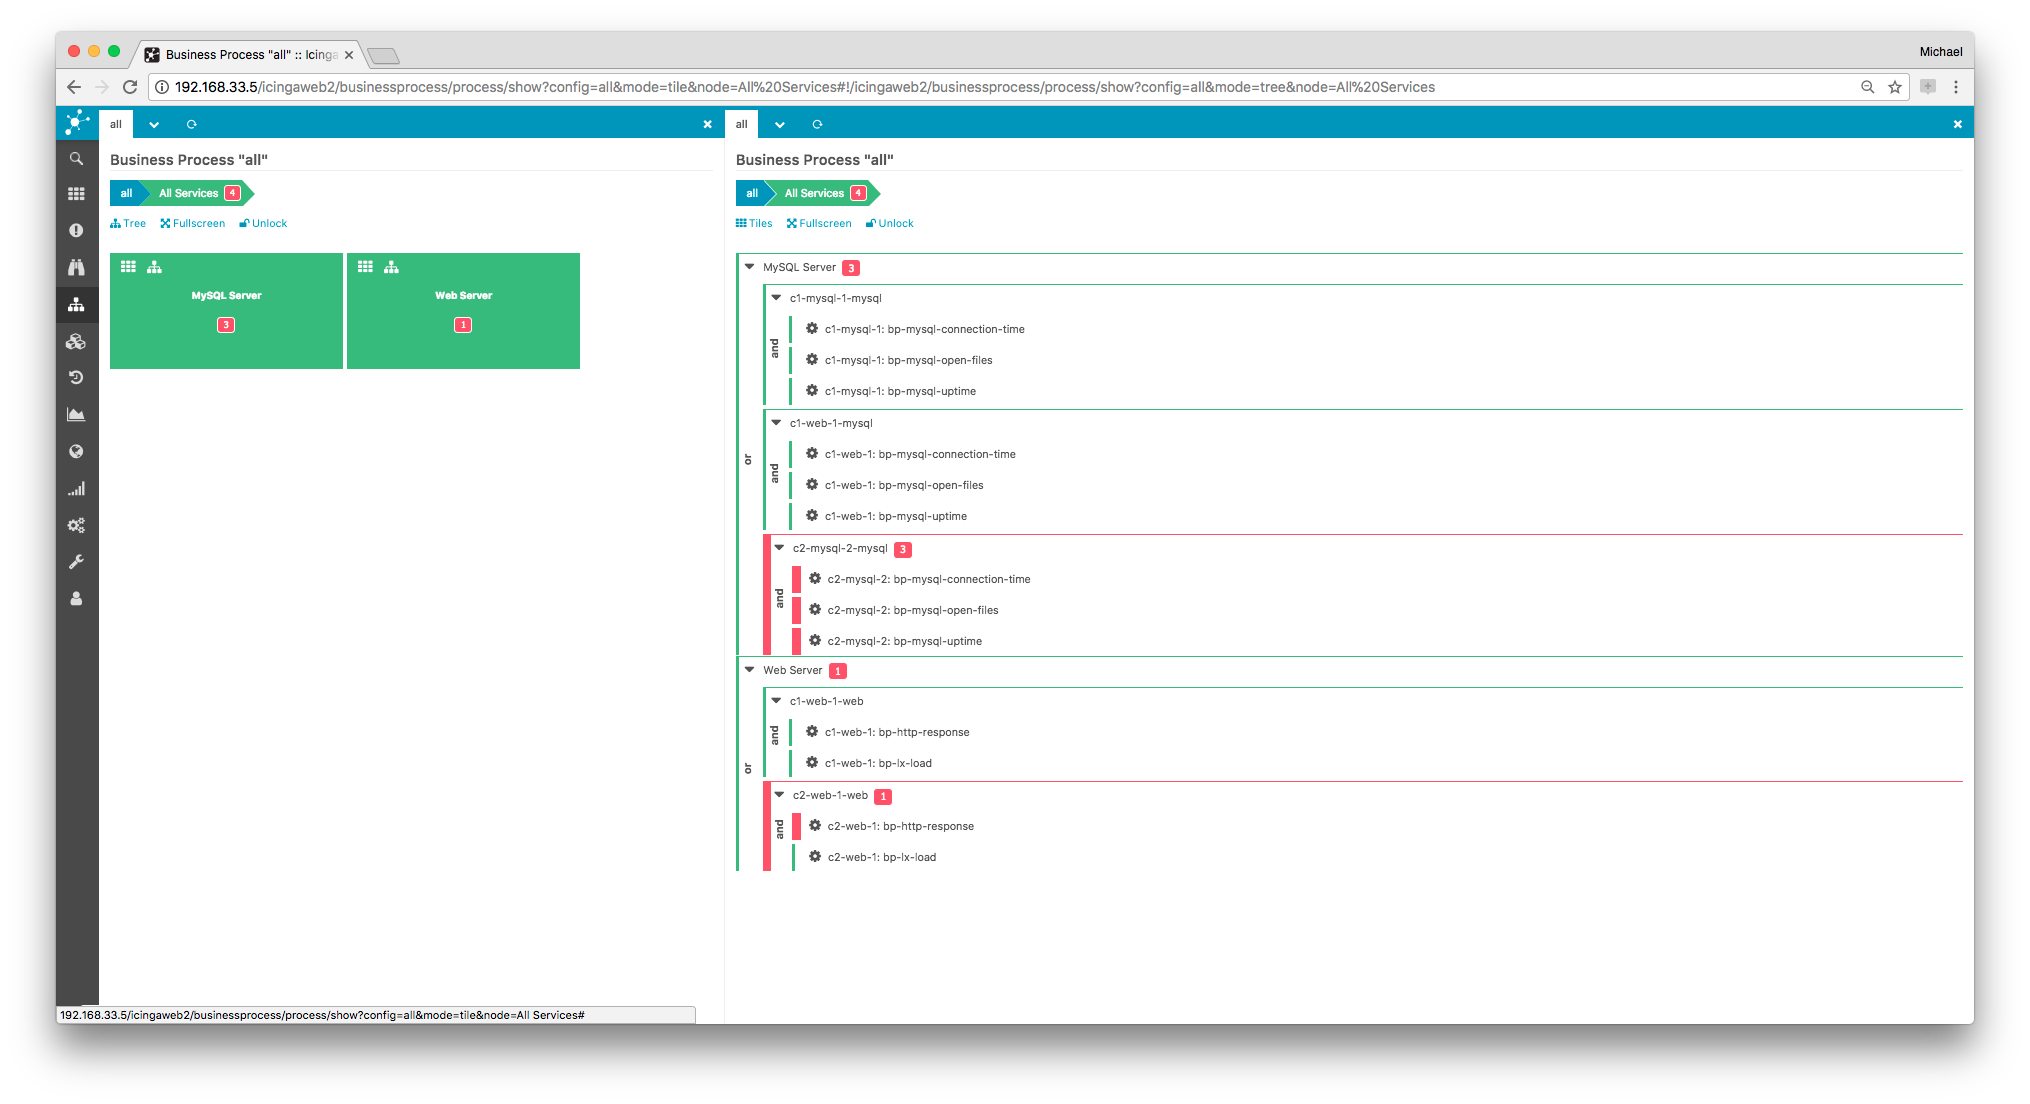
Business Process 
Create top-level views of your applications in a graphical editor. Rules express dependencies between existing hosts and services and let you alert on application level. Business processes are displayed in a tree or list overview and can be added to any dashboard.
NagVis 
By using the DB IDO feature you can create your own network maps based on your monitoring configuration and status data using NagVis.
The configuration in nagvis.ini.php should look like this for Livestatus for example:
[backend_live_1]
backendtype="mklivestatus"
socket="unix:/var/run/icinga2/cmd/livestatus"
If you are planning an integration into Icinga Web 2, look at this module.
Icinga Reporting 
By enabling the DB IDO feature you can use the Icinga Reporting package.
Thruk 
Thruk is an alternative web interface which can be used with Icinga 2 and the Livestatus feature.
Log Monitoring 
Using Logstash or Graylog in your infrastructure and correlate events with your monitoring is even simpler these days.
- Use the
GelfWriterfeature to write Icinga 2’s check and notification events to Graylog or Logstash. - Configure the logstash
nagiosoutput to send passive traps to Icinga 2 using the external command pipe. - Execute a plugin to check Graylog alert streams.
More details can be found in this blog post.
Notification Scripts and Interfaces 
There’s a variety of resources available, for example different notification scripts such as:
- E-Mail (examples provided)
- SMS
- Pager (XMPP, etc.)
- IRC
- Ticket systems
- etc.
Additionally external services can be integrated with Icinga 2:
More information can be found on the Icinga Website.
Configuration Management Tools 
If you require your favourite configuration tool to export the Icinga 2 configuration, please get in touch with their developers. The Icinga project does not provide a configuration web interface yet. Follow the Icinga Blog for updates on this topic.
If you’re looking for puppet manifests, chef cookbooks, ansible recipes, etc. – we’re happy to integrate them upstream, so please get in touch with the Icinga team.
These tools are currently in development and require feedback and tests:
More Addon Integration Hints 
PNP Action Url 
They work in a similar fashion for Icinga 2 and are used for 1.x web interfaces (Icinga Web 2 doesn’t require the action url attribute in its own module).
template Host "pnp-hst" {
  action_url = "/pnp4nagios/graph?host=$HOSTNAME$"
}

template Service "pnp-svc" {
  action_url = "/pnp4nagios/graph?host=$HOSTNAME$&srv=$SERVICEDESC$"
}
PNP Custom Templates with Icinga 2 
PNP automatically determines the graph template from the check command name (or the argument’s name). This behavior changed in Icinga 2 compared to Icinga 1.x. Though there are certain possibilities to fix this:
- Create a symlink for example from the
templates.dist/check_ping.phptemplate to the actual check name in Icinga 2 (templates/ping4.php) - Pass the check command name inside the format template configuration
The latter becomes difficult with agent based checks like NRPE or SSH where the first command argument acts as
graph template identifier. There is the possibility to define the pnp template name as custom attribute
and use that inside the formatting templates as SERVICECHECKCOMMAND for instance.
Example for services:
# vim /etc/icinga2/features-enabled/perfdata.conf

service_format_template = "DATATYPE::SERVICEPERFDATA\tTIMET::$icinga.timet$\tHOSTNAME::$host.name$\tSERVICEDESC::$service.name$\tSERVICEPERFDATA::$service.perfdata$\tSERVICECHECKCOMMAND::$service.check_command$$pnp_check_arg1$\tHOSTSTATE::$host.state$\tHOSTSTATETYPE::$host.state_type$\tSERVICESTATE::$service.state$\tSERVICESTATETYPE::$service.state_type$"

# vim /etc/icinga2/conf.d/services.conf

template Service "pnp-svc" {
  action_url = "/pnp4nagios/graph?host=$HOSTNAME$&srv=$SERVICEDESC$"
  vars.pnp_check_arg1 = ""
}

apply Service "nrpe-check" {
  import "pnp-svc"
  check_command = nrpe
  vars.nrpe_command = "check_disk"

  vars.pnp_check_arg1 = "!$nrpe_command$"
}
If there are warnings about unresolved macros, make sure to specify a default value for vars.pnp_check_arg1 inside the
In PNP, the custom template for nrpe is then defined in /etc/pnp4nagios/custom/nrpe.cfg
and the additional command arg string will be seen in the xml too for other templates.