Issue History and Details
For convenience, this module comes with a nice overview of your created Jira issues. It shows your most recent issues, combined with the most important details. Please note that only issues created by the configured Jira user will be shown.
Issue History Table
This table shows three icons in the first column, the related project, issue type and current state. Please move the mouse over those icons to get more details.
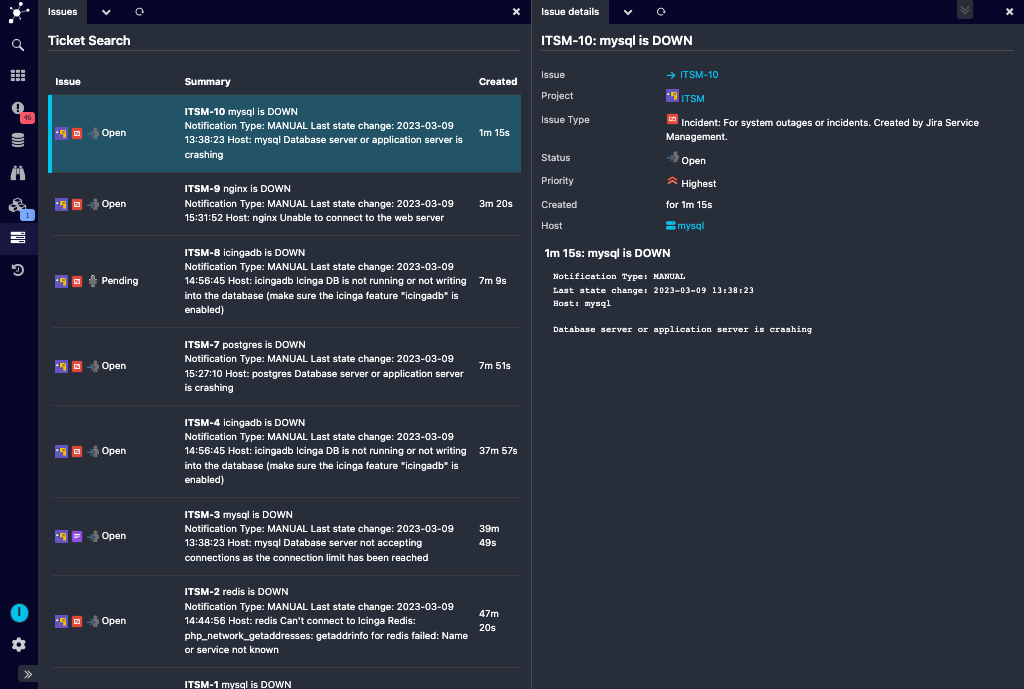
The Summary column shows issue summary and description, and the last column shows how long ago the issue has been created. Move the mouse over the shown time to read the full related creation time with timezone details.
You can then choose an issue, and you’ll provided with some more details. All comments posted to this issue will be shown. Also, there are and some links pointing to Jira (directly to the issue or to it’s project) and to the related Icinga Host or Service.
Monitoring / Icinga DB Web integration
It is also possible to filter the issue list by host (and optionally servcie) name. Not need to manually
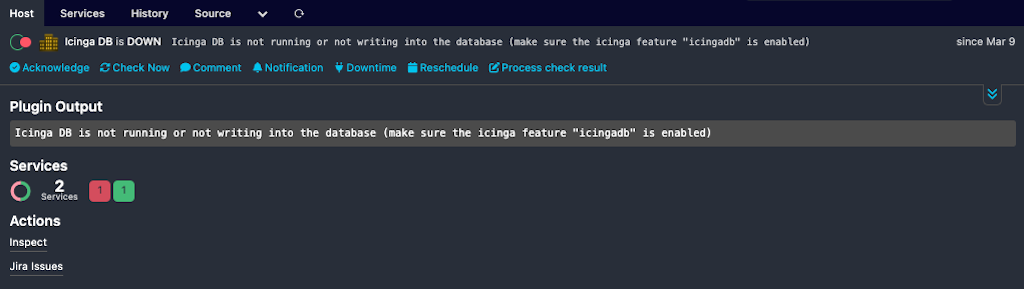
This module hooks into the monitoring or icingadb module and provides so-called Host and
Service Action Hooks. A single click brings you to your Host (or Service) issue
history.