Grafana Integration
Icinga for Windows provides default dashboards for Grafana, allowing an easy overview of the current performance metric and integration with Icinga Web.
Requirements
To use Icinga for Windows Grafana Dashboards, you require the following components:
- InfluxDB 2
- Grafana 9.x (or later)
- Icinga Web Grafana Module
- Icinga InfluxDB 2 Writer Feature enabled
Please note that dashboards might also work with older Grafana versions (like version 8.x or 7.x), but wasn’t tested with those versions.
Installation
Install Grafana Dashboards
Each plugin repository ships with a bunch of .json files, containing the configuration for the Grafana dashboards. These are located inside config/grafana/dashboards/.
To Import these dashboards, you simply have to navigate to Dashboards -> Import inside Grafana
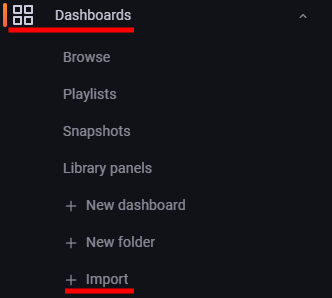
On the section Import via panel json, copy the content of the .json file you wish to import or select the file to import. Repeat this process for each single file. There is currently no option to import multiple files at once.
Update Dashboard Configuration
Last but not least, we require to update each Grafana dashboard to properly use your InfluxDB 2 Bucket for the monitoring data collected by Icinga, unless your default Icinga monitoring bucket is called icinga2.
To do so, open the dashboard you want to edit and hit the settings icon ![]() on the top right of the window.
on the top right of the window.
Now on the left side, click on Variables and search for the variable influxbucket on the right side. Click on the table entry with the name influxbucket and modify the Constant options Value with the name of the InfluxDB 2 Bucket, your Icinga is writing monitoring metrics into.
Set InfluxDB Backend as default
In case you are running multiple backends or require to save a certain backend as default, you can simply update each dashboard by selecting the correct InfluxDB backend for the variable InfluxDB DataSource.
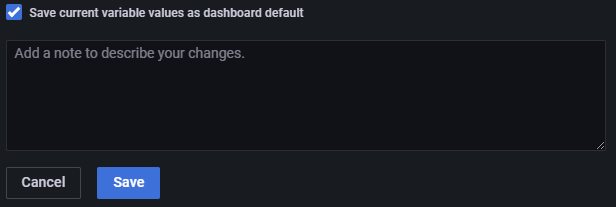
Once selected, head over to the save icon ![]() on the top right side, click on it and afterwards select the checkbox
on the top right side, click on it and afterwards select the checkbox Save current variable values as dashboard default and click on Save.
Once done, this backend will be used whenever you load the dashboard. This is especially required for the below Icinga Web integration, ensuring that information can be fetched.
Updating Dashboards
We do not recommend to manually modify or change on how the dashboards display metrics or extend them. You can use our dashboards as templates or provide pull requests/feature request on the component repositories.
Icinga will provide frequent updates for the dashboards, which will overwrite your manual changes.
To update new provided dashboards, you will have to delete the dashboard and import it again as described above.
Install Icinga Web Module
By default, you have to install the Icinga Web Grafana Module into
/usr/share/icingaweb2/modules/
Once installed, you can enable the module with the icingacli
icingacli module enable grafana
Configure Module
In case you already have the Icinga Web Grafana Module installed and configured, you can skip this section!
You can either edit the configuration for the module within Icinga Web or edit the config.ini at /etc/icingaweb2/modules/grafana/
[grafana]
host = "grafana.example.com:3000"
protocol = "http"
timerangeAll = "1w/w"
defaultdashboarduid = "QsPVl5W4z"
defaultdashboardpanelid = "1"
shadows = "0"
theme = "dark"
datasource = "influxdb"
accessmode = "iframe"
debug = "0"
defaultdashboard = "windows-plugins-web"
defaultorgid = "1"
ssl_verifypeer = "0"
ssl_verifyhost = "0"
custvardisable = ""
timerange = "1h"
Please update the field host accordingly. The defaultdashboarduid with value QsPVl5W4z is the Icinga for Windows Windows-Plugins-Web-Template id, while the defaultdashboard with windows-plugins-web is the name.
Install Icinga for Windows Graphs
Each Icinga for Windows plugin repository, contains a config folder in which a grafana folder is present with dashboards and icingaweb2-grafana graphs.
To ensure the Icinga Web Grafana Module is using the correct Grafana dashboards for the Icinga for Windows plugins, you can copy the content of the graphs.ini within the plugin repositories (config/grafana/icingaweb2-grafana/) into the Grafana Module graphs.ini.
The default location is
/etc/icingaweb2/modules/grafana/graphs.ini
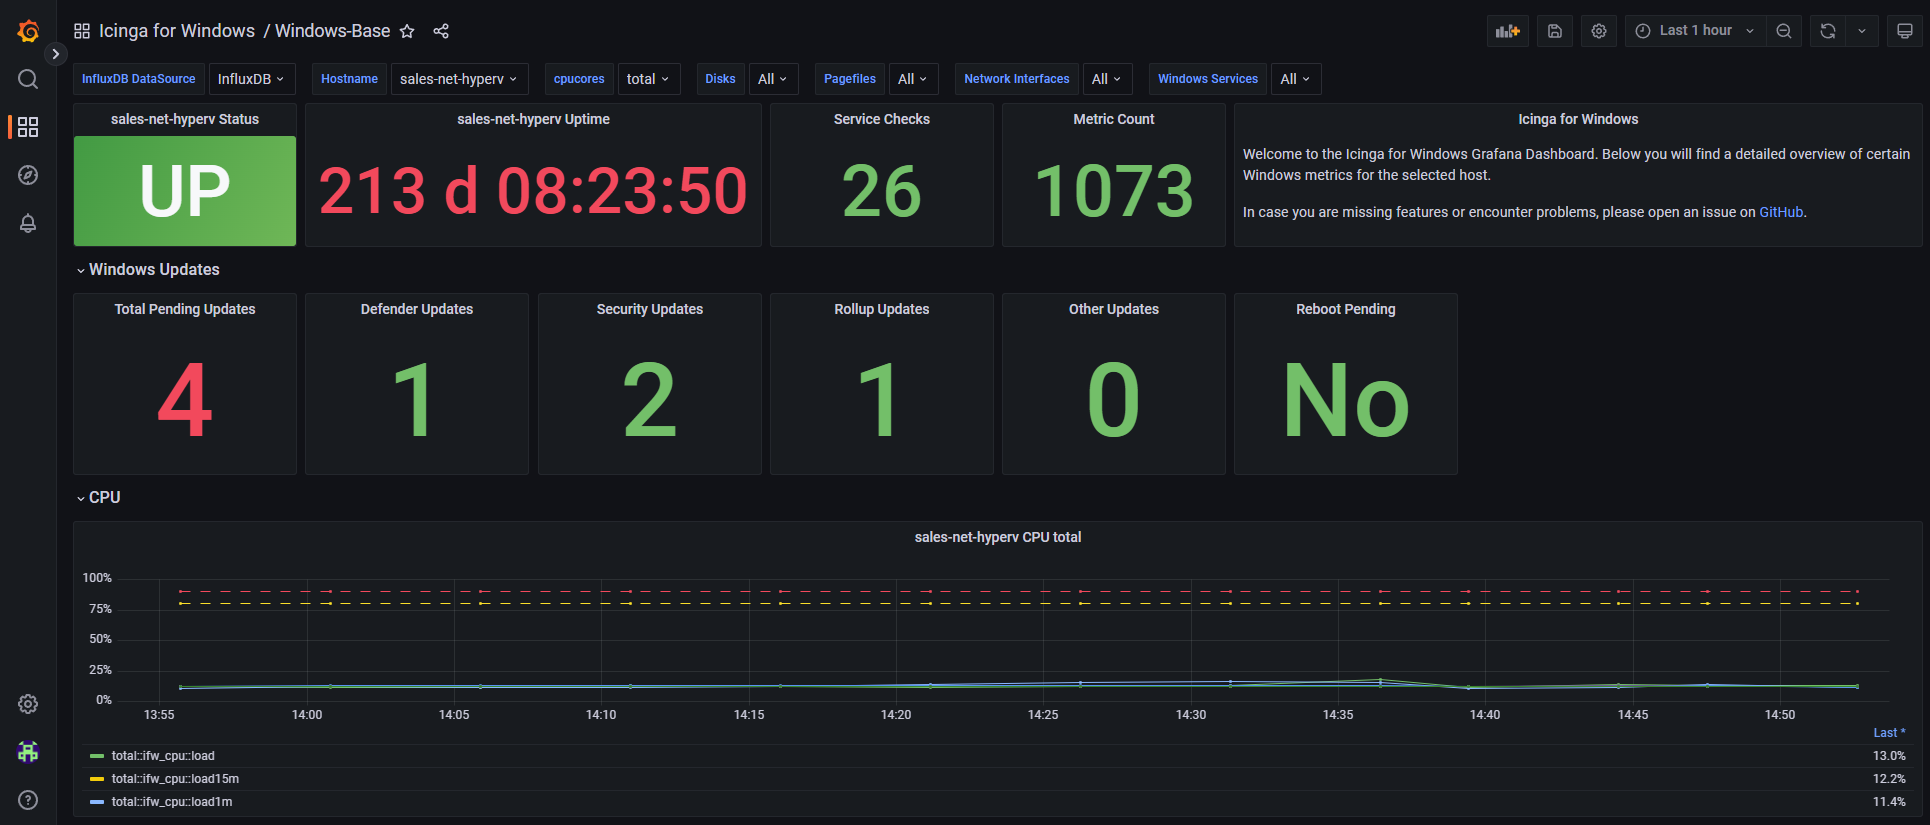
Overview
Once all above steps are successfully completed, you can have a look on your Grafana dashboards